// article
Attention and Performance
Focused attention wins by 1.68 points, until the task gets easier
Split your attention and your score drops by 1.68 points. That is the headline from a small attention experiment in the seaborn data collection (load("attention"), sourced via seaborn-data): 20 people, 6 conditions, 60 rows. The focused condition averaged 6.80; the divided condition averaged 5.12. The gap is 1.68 points, and it is not noise. A Welch t-test gives t(53.9) = 4.68, p = 0.00002, with a Cohen’s d of 1.21.
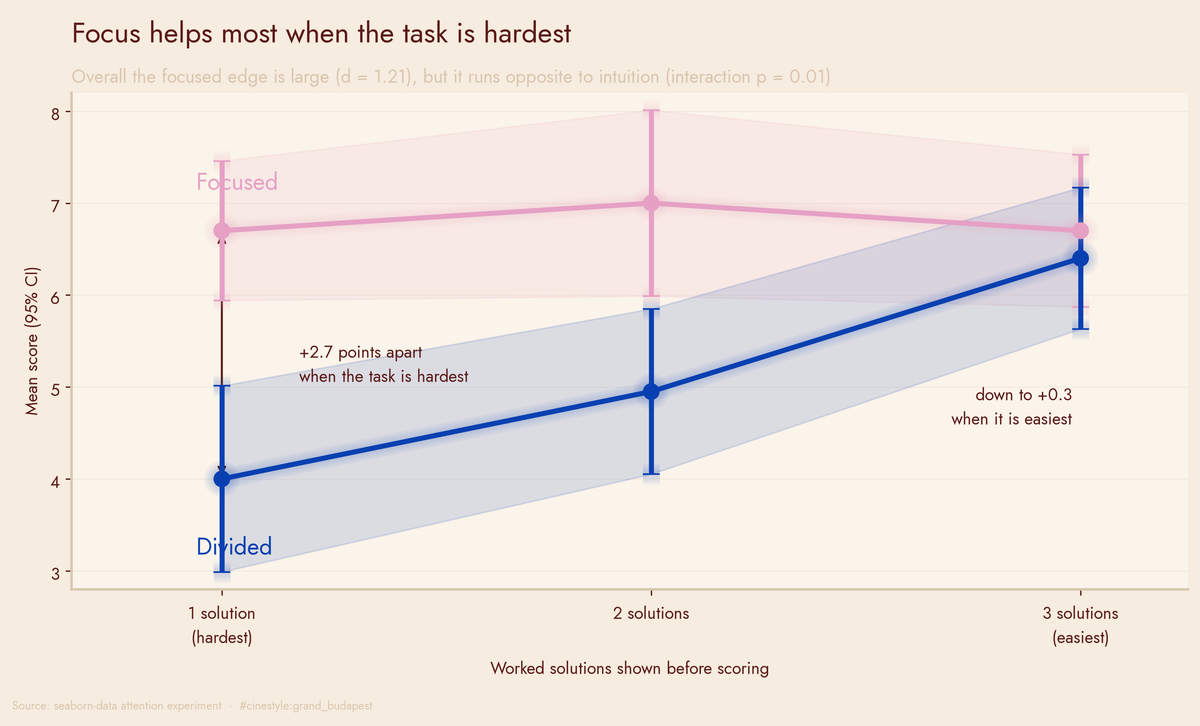
That d above 1 is large, and the headline is tidy: focus helps, so go close your Slack. The flagship figure is where the story turns. Focus pays off most when the task is hardest and almost stops mattering when it is easy. That is the opposite of what most people would guess.
The setup, honestly
The data is balanced and clean. Two attention conditions, divided and focused. A solutions column taking the values 1, 2, and 3. The seaborn file does not document what it counts; I read higher values as an easier task, because scores rise with it, and that reading is an assumption. And the score itself. Every one of the six cells holds exactly 10 observations. No missing values, no cleaning.
That balance hides the real constraint. There are 20 people, 10 per attention condition, and each person is measured at all three solution levels. The 30-versus-30 in the t-test is therefore 10 people per side, each counted three times. The t-test and the ANOVA below both treat the 60 rows as independent (the ANOVA’s residual degrees of freedom are 54), so every p-value is optimistic. A repeated-measures model would be the right fix, and I have not fitted one. When I say n, I mean 20 people.
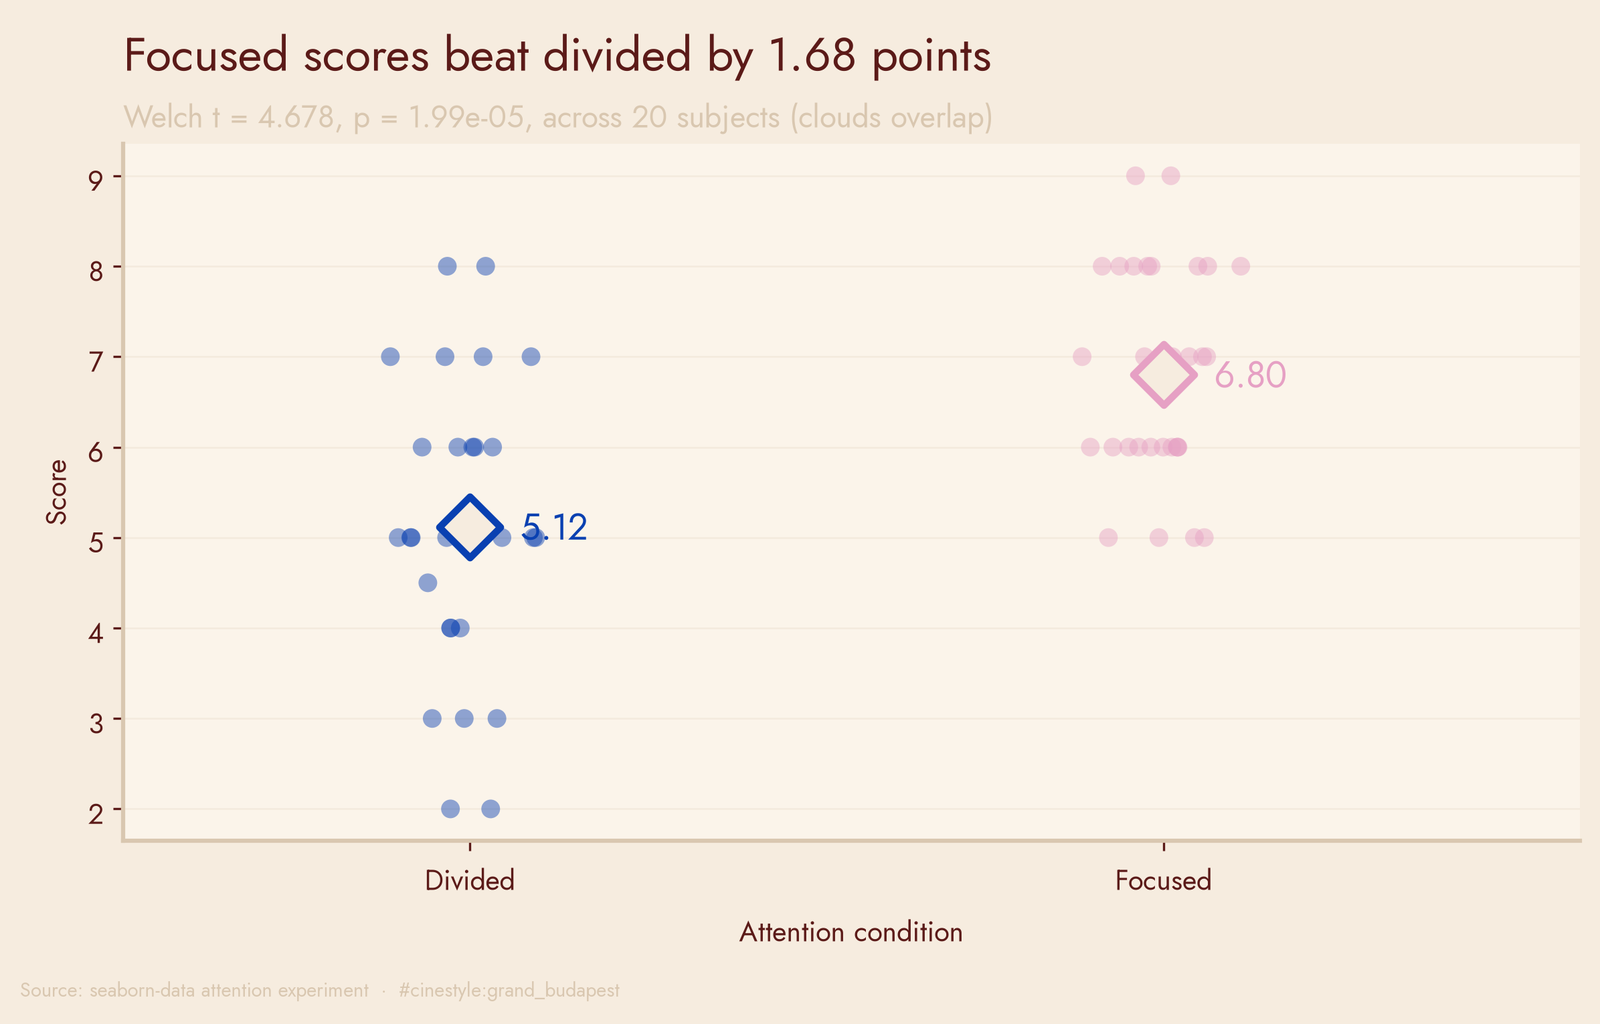
The group-means figure shows the split cleanly, and it shows the catch. The divided cloud is wider (SD 1.57 versus 1.19 for focused), and some divided scores sit above the focused mean of 6.80. The separation is real on average. It is not two non-overlapping blobs. Sixty points let you see the overlap with your eyes, which is the right amount of humility for a sample this size.
Score climbs with the number of solutions
Pool both conditions and look at score by solution count: 5.35 at one solution, 5.98 at two, 6.55 at three. Monotonic, in the direction you would guess. A Spearman correlation puts the trend at rho = 0.28, p = 0.031. In the two-way ANOVA the solutions main effect lands at F = 4.70, p = 0.013.
Both main effects clear p < 0.05 and point the sensible way. This is where most write-ups would wrap.
The turn: the focused edge collapses
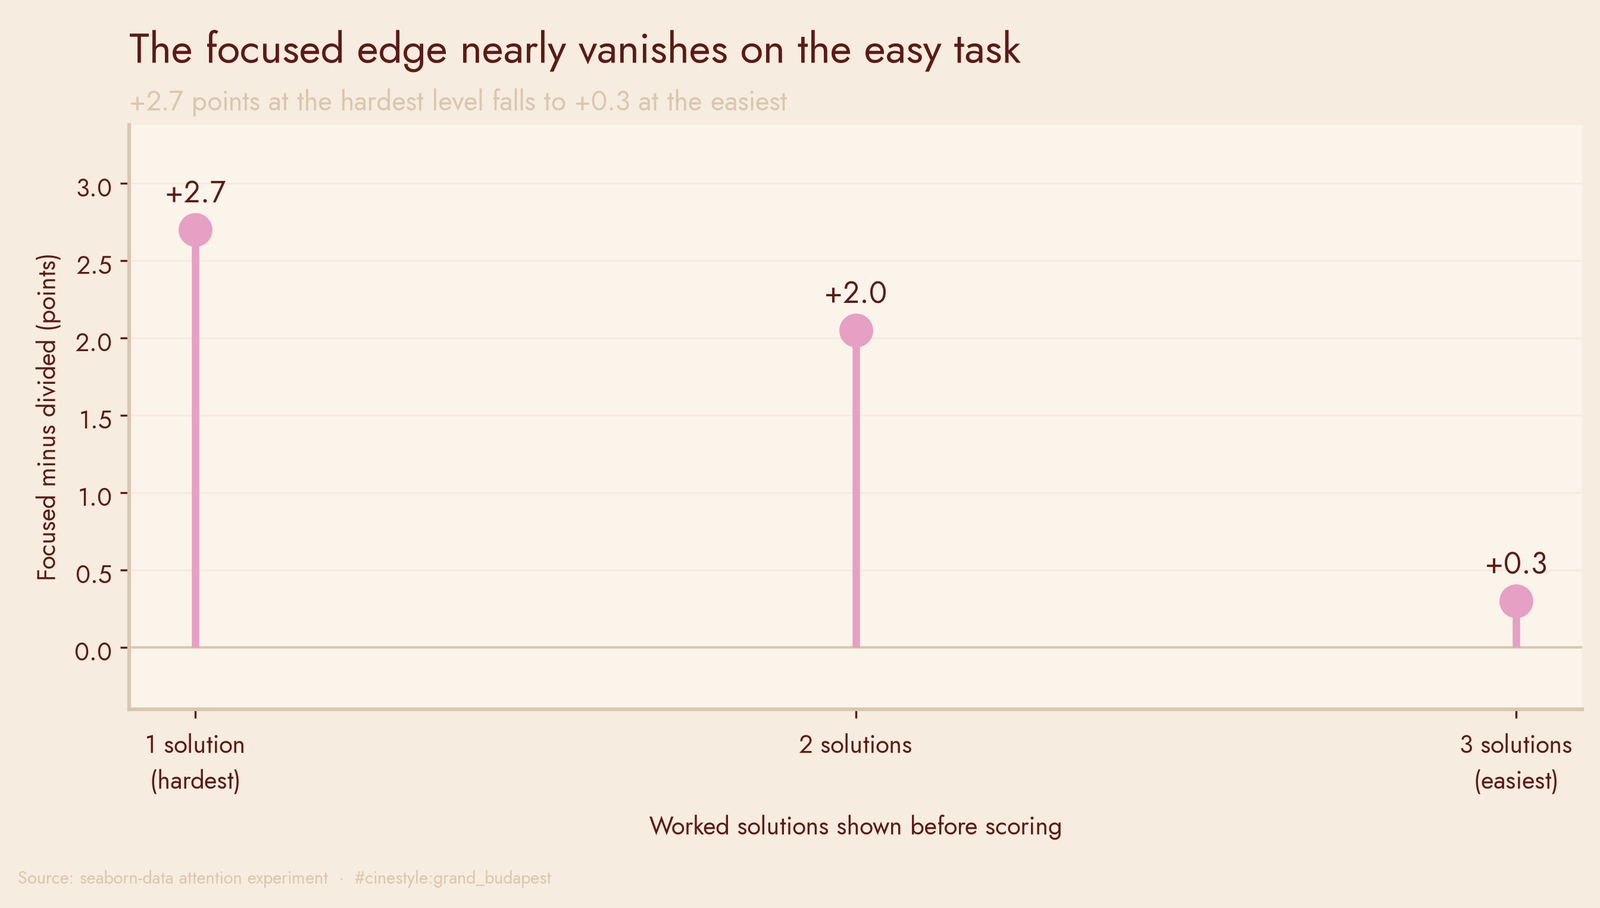
The focused advantage is not constant across difficulty. At one solution, focused beats divided by 2.7 points. At two solutions, by 2.05. At three solutions, by 0.3. As the solution count rises, the edge does not grow; it nearly vanishes.
Picture the two lines in the flagship as two runners. The focused runner starts near the finish and barely moves: 6.7, 7.0, 6.7 across the three levels. The divided runner starts far back and sprints: 4.0, then 4.95, then 6.4, nearly drawing level by the easy task. The whole gap is the divided runner catching up, not the focused one pulling away. My read is that focus buys you the most on the hardest version of the task. On the easiest version, divided-attention people recover most of the gap.
The two-way ANOVA backs this up. The attention-by-solutions interaction comes in at F = 5.02, p = 0.010, clearing the same bar the main effects did. But I want to be careful about how hard I lean on that 0.010. An interaction term is a difference of differences, and each cell mean rests on 10 observations. The interaction lives on the smallest, noisiest quantities in the dataset. A single odd subject in the divided-three-solutions cell could swing the 0.3 gap. The cross-check I ran on the main effect (Mann-Whitney p = 0.00005, matching the t-test) has no clean rank-based equivalent for “is this cell pattern non-additive” that I would trust at n = 10 per cell. The interaction is significant, and one odd subject could erase it.
What I would actually claim
The focused-versus-divided main effect, I will stand behind: 1.68 points, d = 1.21, p = 0.00002, and a nonparametric test that agrees. That is about as solid as a 20-person dataset gets, with the caveat that the p-value treats repeated measurements as independent.
The interaction I will report and not bank on. It is statistically significant and directionally clean: focused stays flat while divided catches up. It is also the kind of finding a study this size exists to generate, not to confirm. If someone handed me a budget, the interaction is the hypothesis I would power a real experiment around: does focus mainly matter when the task is hardest? This data suggests yes but is too small to settle it.
There is also a confound I cannot rule out. Every subject sees all three solution levels, and four columns do not tell me the order they came in, so practice or fatigue could be mixed into the solutions effect. I am reading it as suggestive structure in a small dataset, which is the most these 60 rows can honestly support.
The number I keep coming back to is the 0.3. At three solutions, the entire focused advantage, the thing worth 2.7 points at one solution, is down to almost nothing. Whether that is a real ceiling effect or ten people having a good day, I cannot tell from here. A significant p-value on a tiny study tells you where to look next, not what is true.