// article
The Bechdel Plateau
The Bechdel test: the pass rate climbed, then stopped
The Bechdel test asks one cheap question of a movie. Does it have two named women who talk to each other about something other than a man? It is a low bar that almost any film about actual people should clear without trying. Across 1,794 films from 1970 to 2013, only 44.8% do; 991 fail.
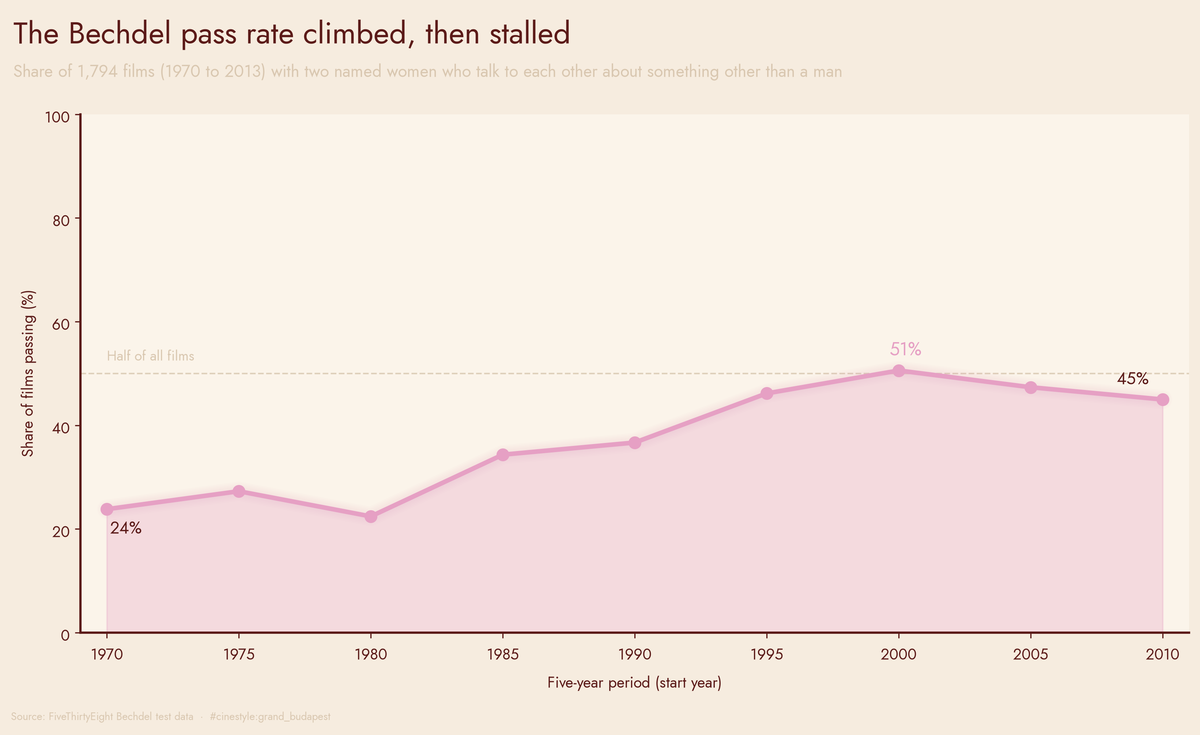
The pass rate roughly doubled across the first thirty years, then ran into a ceiling around the halfway mark and stayed there. The bar did not get harder; the industry stopped clearing it any faster.
The data is FiveThirtyEight’s Bechdel-test set: 1,794 films scored PASS or FAIL on the binary test, with budget and gross figures, and with an inflation-adjusted budget column in 2013 dollars. That adjustment matters, and I come back to it.
The trend: real gains, then a plateau
Group the films by decade and the climb is plain.
- 1970s: 25.9% (n=54)
- 1980s: 28.8% (n=125)
- 1990s: 43.6% (n=337)
- 2000s: 48.7% (n=840)
- 2010s: 45.0% (n=438)
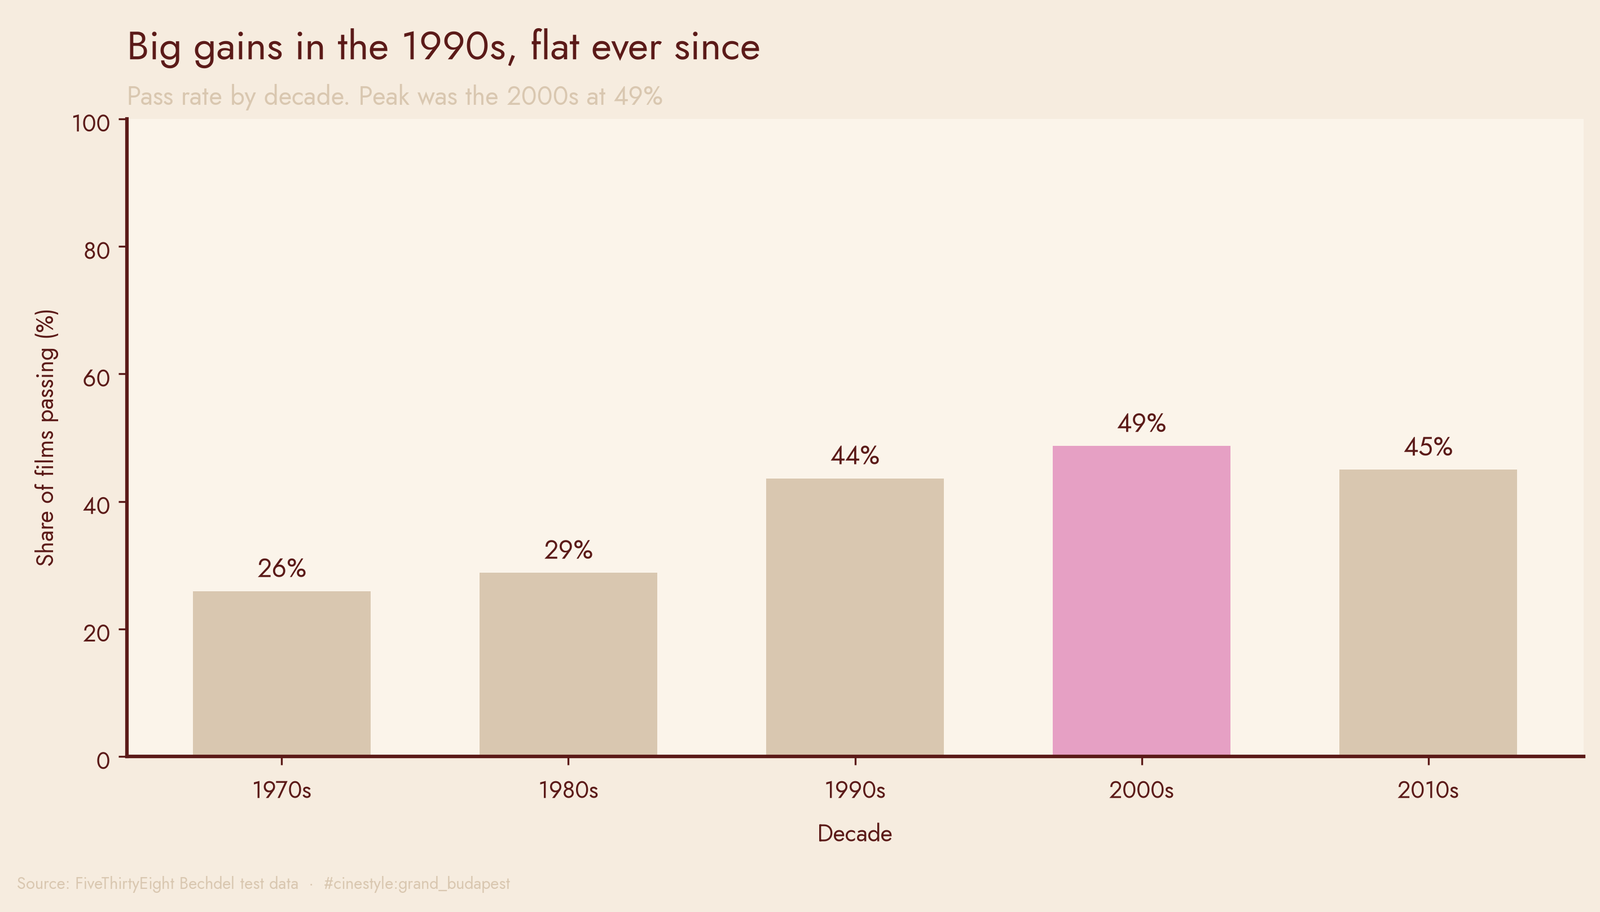
The 1990s did the heavy lifting, a fifteen-point jump over the 1980s. After that the line goes flat. The peak decade is the 2000s at 48.7%, and the 2010s come in slightly below it at 45.0%. The early decades carry small samples, so I would not read the 1970s number to the decimal. The plateau, though, sits on the densest part of the data: the 2000s alone hold 840 films, and the 2010s dip to 45.0% is too small to call a decline. The five-year bins show the same flattening at finer grain: 50.6% for 2000 to 2004 (n=352), 47.3% for 2005 to 2009 (n=488), and 45.0% for 2010 to 2013 (n=438).
I did not test whether that slide from 50.6% to 45.0% is real, so I am not calling it a decline. The rate stopped rising, which after thirty years of gains is its own kind of news.
The kicker: money predicts failure
Here is the part I did not expect. Split the films into four equal groups by budget, smallest to largest, and the pass rate slides straight down.
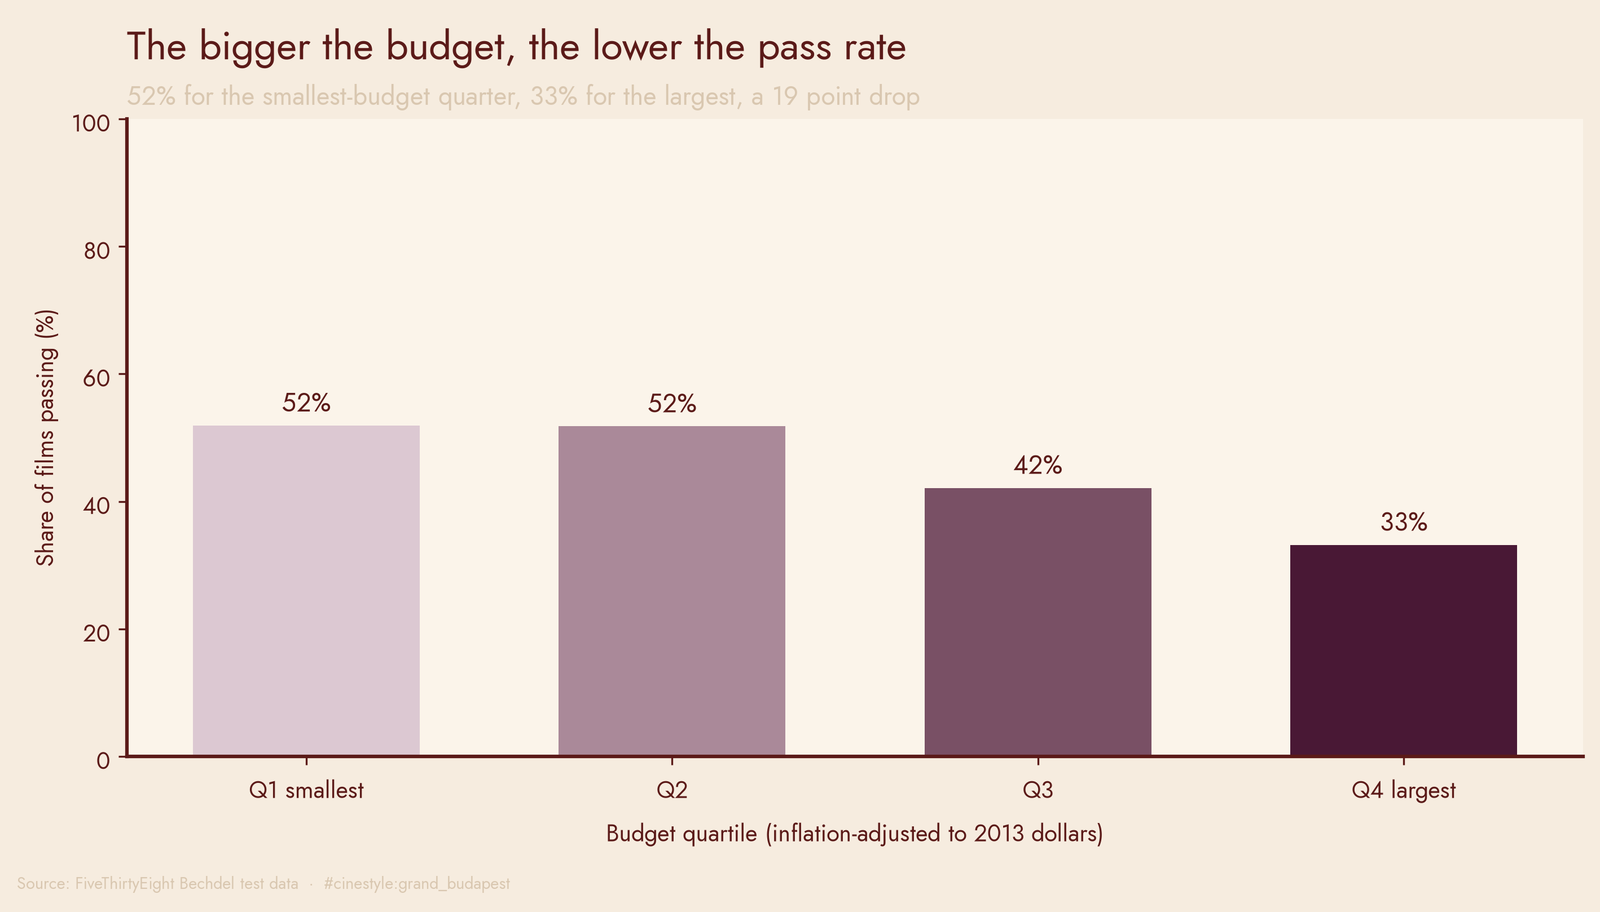
The smallest-budget quarter passes 51.9% of the time. The largest passes 33.2%. That is an 18.7-point gap, but it is not a steady slide. The two cheaper quartiles are level, 51.9% and 51.8%, with median budgets of $7.5 million and $25.9 million. The drop starts in the third quartile, 42.1% at a median of $53.7 million, and deepens in the fourth. The penalty belongs to big budgets, not to money in general.
A budget is a row of zeros, but it is also a room full of people deciding what a story is allowed to be. The more money on the table, the more that room hedges toward a hero, usually a man, and the supporting women orbit him. Picture the budget as a gravity well: the bigger it gets, the more the whole cast bends toward a single center.
The relationship holds when I model it directly. A logistic regression of pass on log budget gives an odds ratio of 0.665 per tenfold increase in budget, with a p-value well below 0.001. Every order of magnitude you spend cuts the odds of passing by roughly a third. That model has one predictor, though. Budgets rose over these four decades and so did pass rates, and the regression does not control for release year, so part of the budget effect may be an era effect. The point-biserial correlation between passing and log budget is -0.12, modest but real at the same significance.
You can also read it the other way around. The median failing film cost 44 million dollars to make; the median passing film cost 31 million.
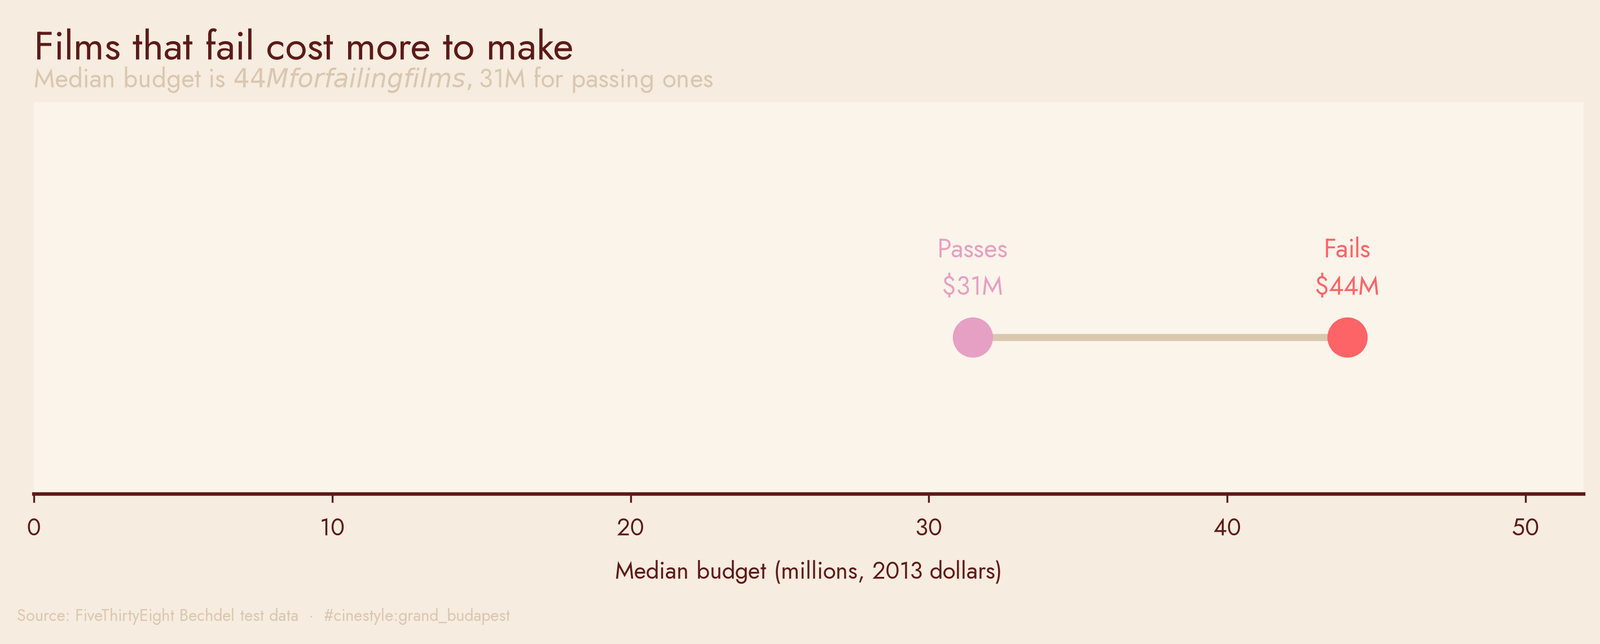
Failure is the more expensive habit. The films that leave women out of their own plots are, on average, the ones the industry bet the most on.
The honest caveat about the money
I used the inflation-adjusted budget column, not the raw one, and that choice is load-bearing. A 20 million dollar film in 1975 and a 20 million dollar film in 2010 are not the same film, and comparing their raw budgets would smuggle four decades of inflation into the budget signal. The 2013-dollar column removes that, and it is the only version where the four quartiles mean the same thing across the whole span. I did not rerun the split on raw budgets.
This is also one scoring system on a curated list, not a census of cinema. The binary test is blunt by design, and the sample skews toward films with budget and box-office data worth recording. So read these as the shape of a large, well-known sample, not a verdict on every movie ever shot.
The test is an ankle-high tripwire, not the point. What the data shows is an industry that learned to step over it through the 1990s, stopped improving around the turn of the century, and still trips most reliably on exactly the films it spends the most to make.