// article
The Candy Power Ranking
The best candy, settled by data
People argue about Halloween candy with the confidence of someone who has never run the numbers. FiveThirtyEight ran the numbers. They put 83 candies into a bracket, collected about 269,000 head-to-head votes on which of two was better, then recorded each candy’s win percent, the share of its head-to-head matchups it won. Reese’s Peanut Butter Cup wins, at 84.2%, and the rest of the field is not close.
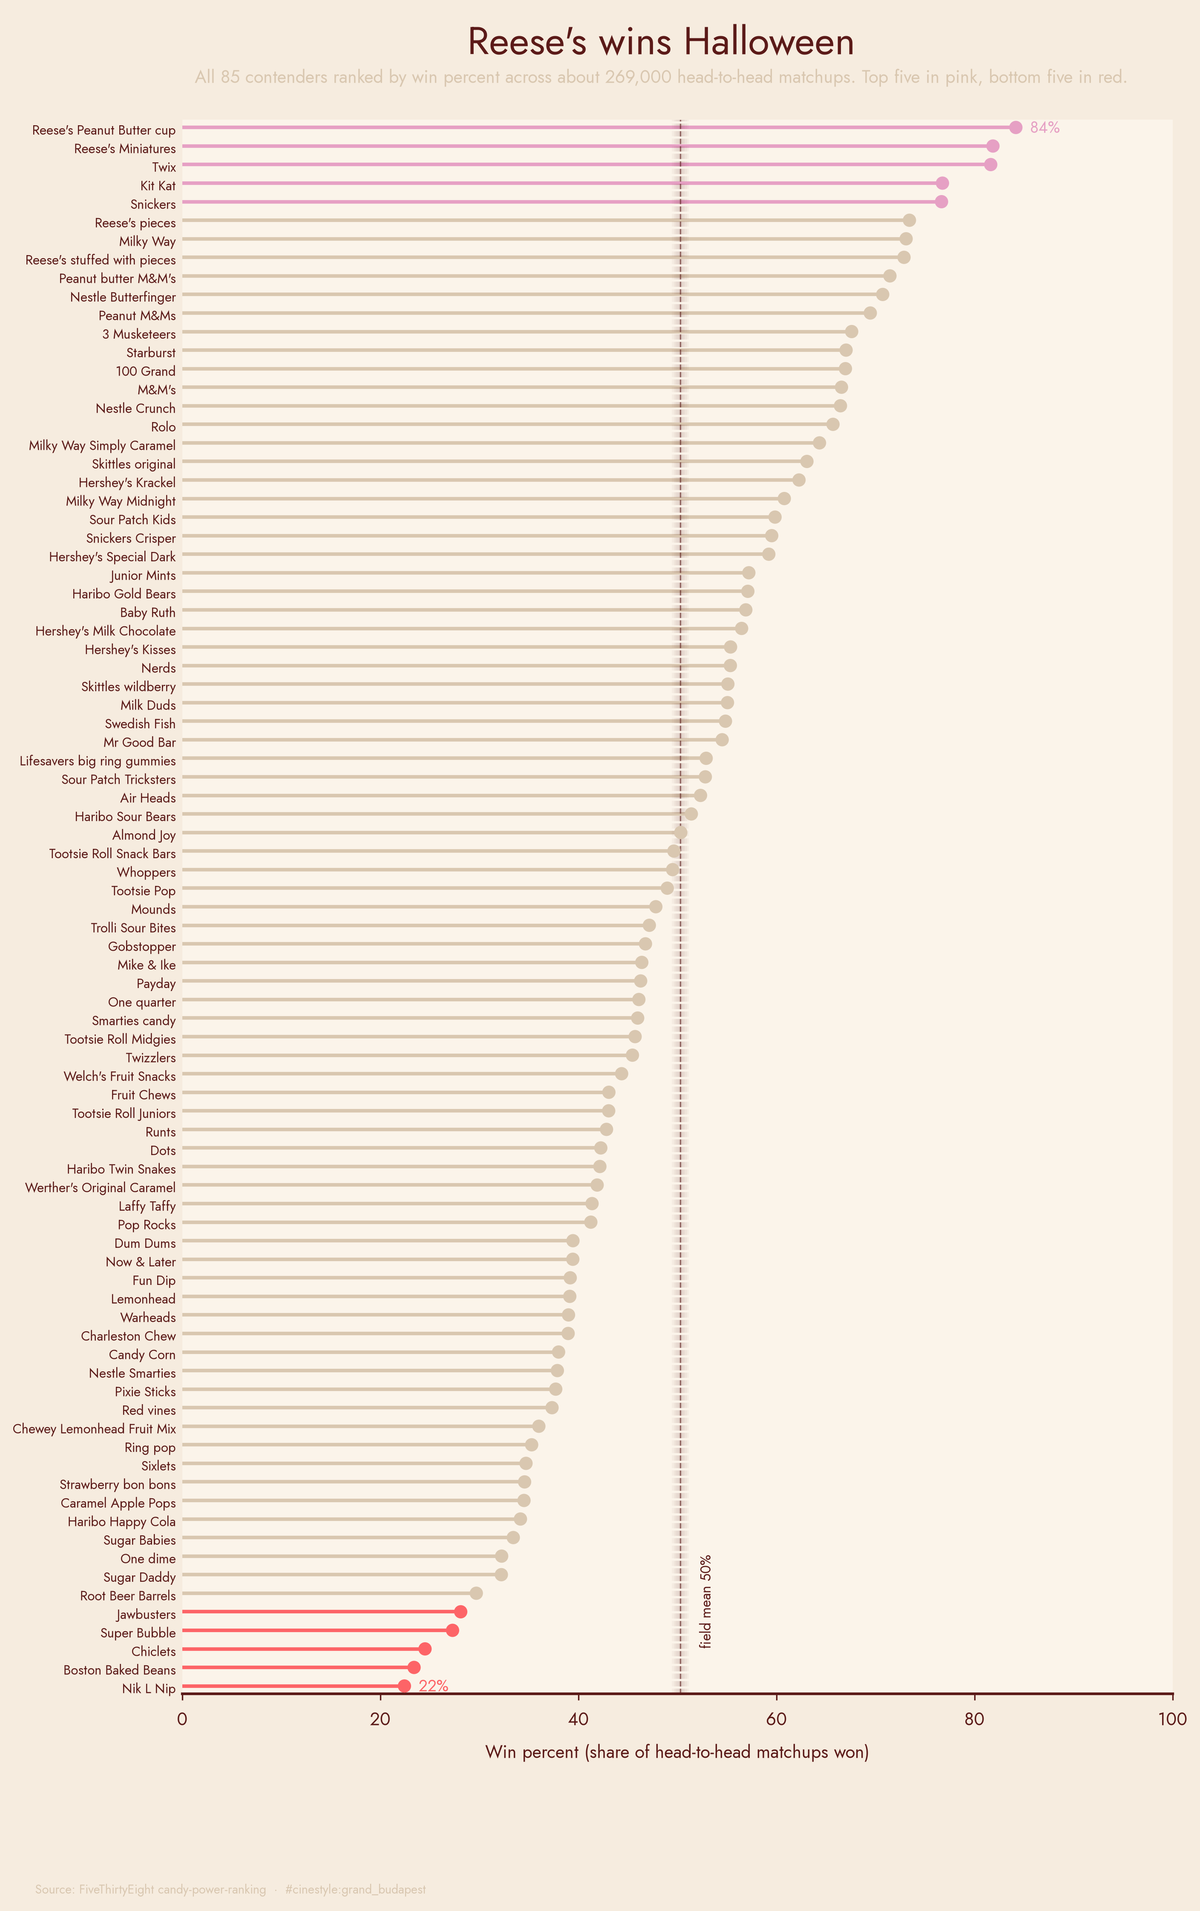
Stem length is win percent, baselined at a true zero, so a longer stem really did win more often. Chocolate holds the top and novelty sugar holds the bottom.
The data is the FiveThirtyEight candy-power-ranking file: 85 rows, each a candy with a win percent and a handful of binary trait flags (chocolate, fruity, caramel, peanut or almond, nougat, crisped rice, hard, bar, pluribus) plus two percentile columns for sugar and price. Two of those 85 rows are not candy. FiveThirtyEight slipped a dime and a quarter into the bracket as controls. One dime scores 32.3%, one quarter 46.1%. People would rather have most candy than a dime.
The ranking is not subtle
Win percent runs from 22.4% at the bottom to 84.2% at the top, with a field mean of 50.3% and a median of 47.8%. The top five are Reese’s Peanut Butter Cup (84.2%), Reese’s Miniatures (81.9%), Twix (81.6%), Kit Kat (76.8%), and Snickers (76.7%). Every one of them is chocolate, and every one adds peanut, caramel, or wafer to it.
The bottom five are Nik L Nip (22.4%), Boston Baked Beans (23.4%), Chiclets (24.5%), Super Bubble (27.3%), and Jawbusters (28.1%). Wax bottles, gum, and jawbreakers. None of them is chocolate. The pattern is visible from across the room, so the real question is how much of the win comes from chocolate and how much from everything else.
What actually makes a candy win
Regress win percent on all eleven traits at once and you can read each trait’s effect with the others held fixed. The model explains 54% of the variance in win percent, which is a lot for nine yes-or-no flags and two percentiles. It is also eleven predictors fitted to 85 rows, so only the strongest effect is solid.
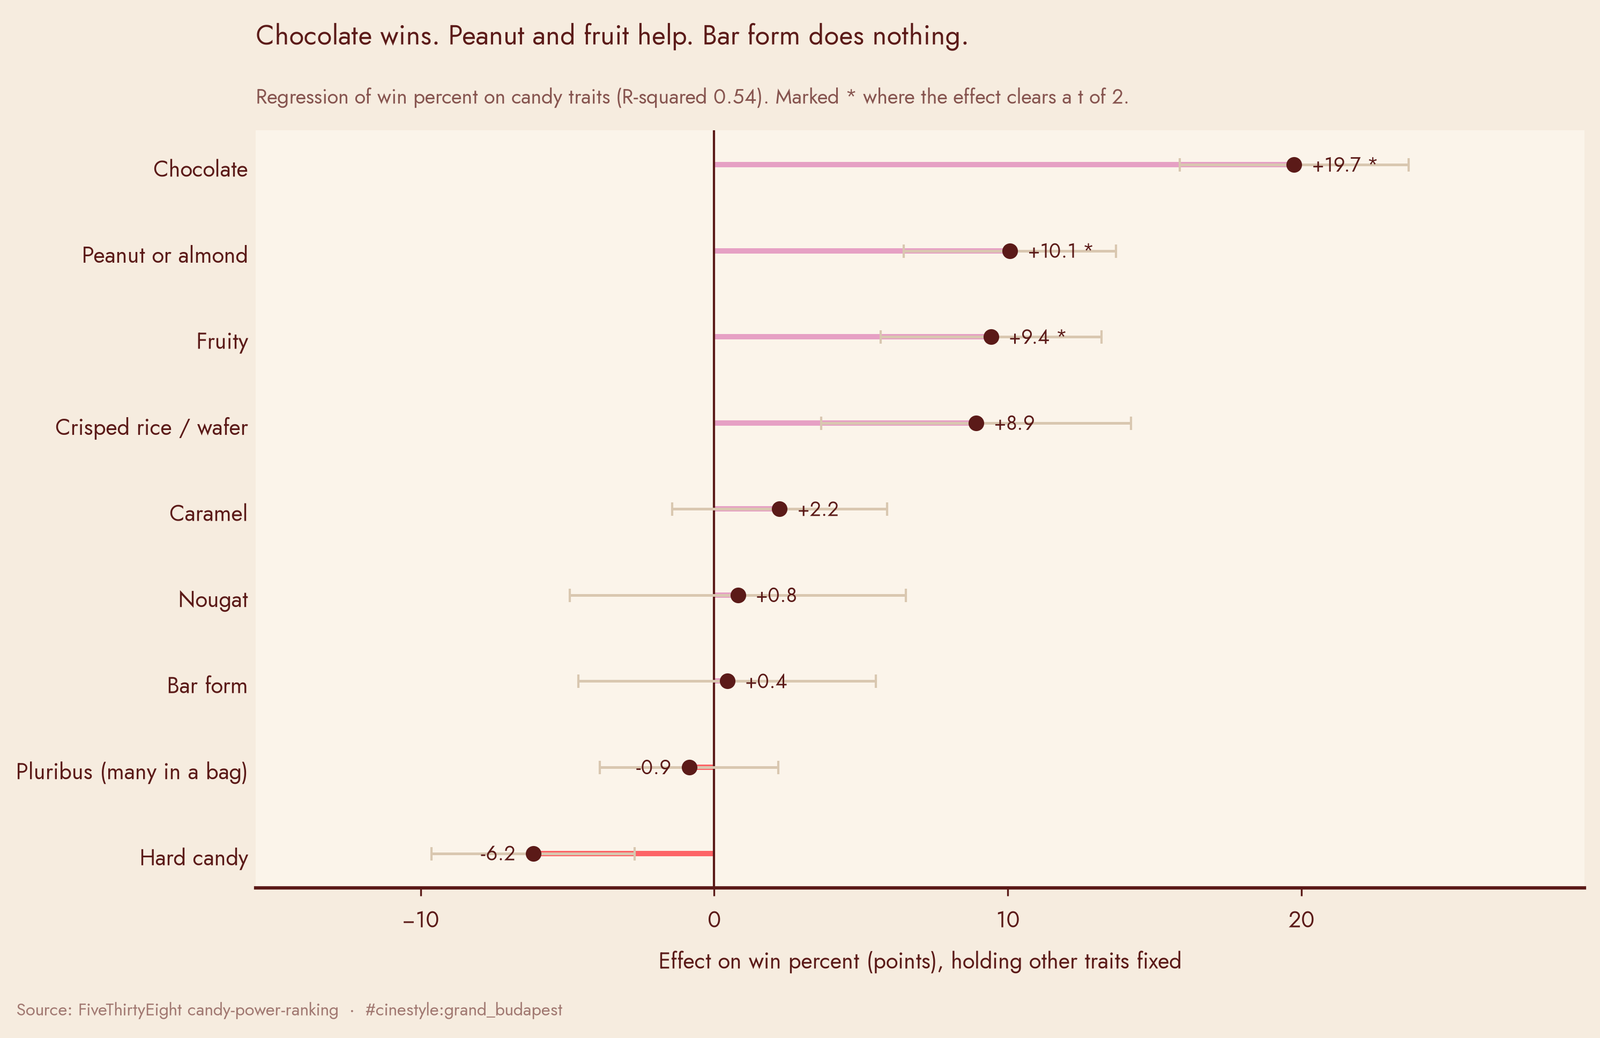
Three traits clear a t-statistic of 2, the rough line where an effect stops looking like noise:
- Chocolate. +19.7 points (t = 5.07).
- Peanut or almond. +10.1 points (t = 2.79).
- Fruity. +9.4 points (t = 2.50).
Chocolate is twice the next-largest effect and the most statistically certain thing in the table. Peanut or almond on top of it is worth another ten points, which is why both Reese’s variants and Snickers cluster at the summit. Fruity helps too, with the other traits held fixed.
Two more traits sit just under the line. Crisped rice or wafer adds +8.9 points (t = 1.69), the Kit Kat and Twix effect. Sugar percentile adds +9.1 (t = 1.95), closer to the line than anything else that missed it.
The more interesting result is what does nothing. Bar form adds +0.44 points (t = 0.09), a coefficient indistinguishable from zero. Nougat is +0.8, caramel +2.2, both statistically silent. This is the regression earning its keep. Bars look like winners because bars are usually chocolate. Strip the chocolate out by controlling for it, and “being a bar” carries no independent weight. What is inside the package matters, not its shape.
Hard candy is the only trait with a sizable negative pull, at -6.2 points, though it falls short of the significance line at t = -1.78. Jawbusters, a hard candy, lives in the cellar for a reason.
Chocolate is most of the gap
You do not need the regression to see the chocolate effect. Split the field in two and the distributions barely overlap.
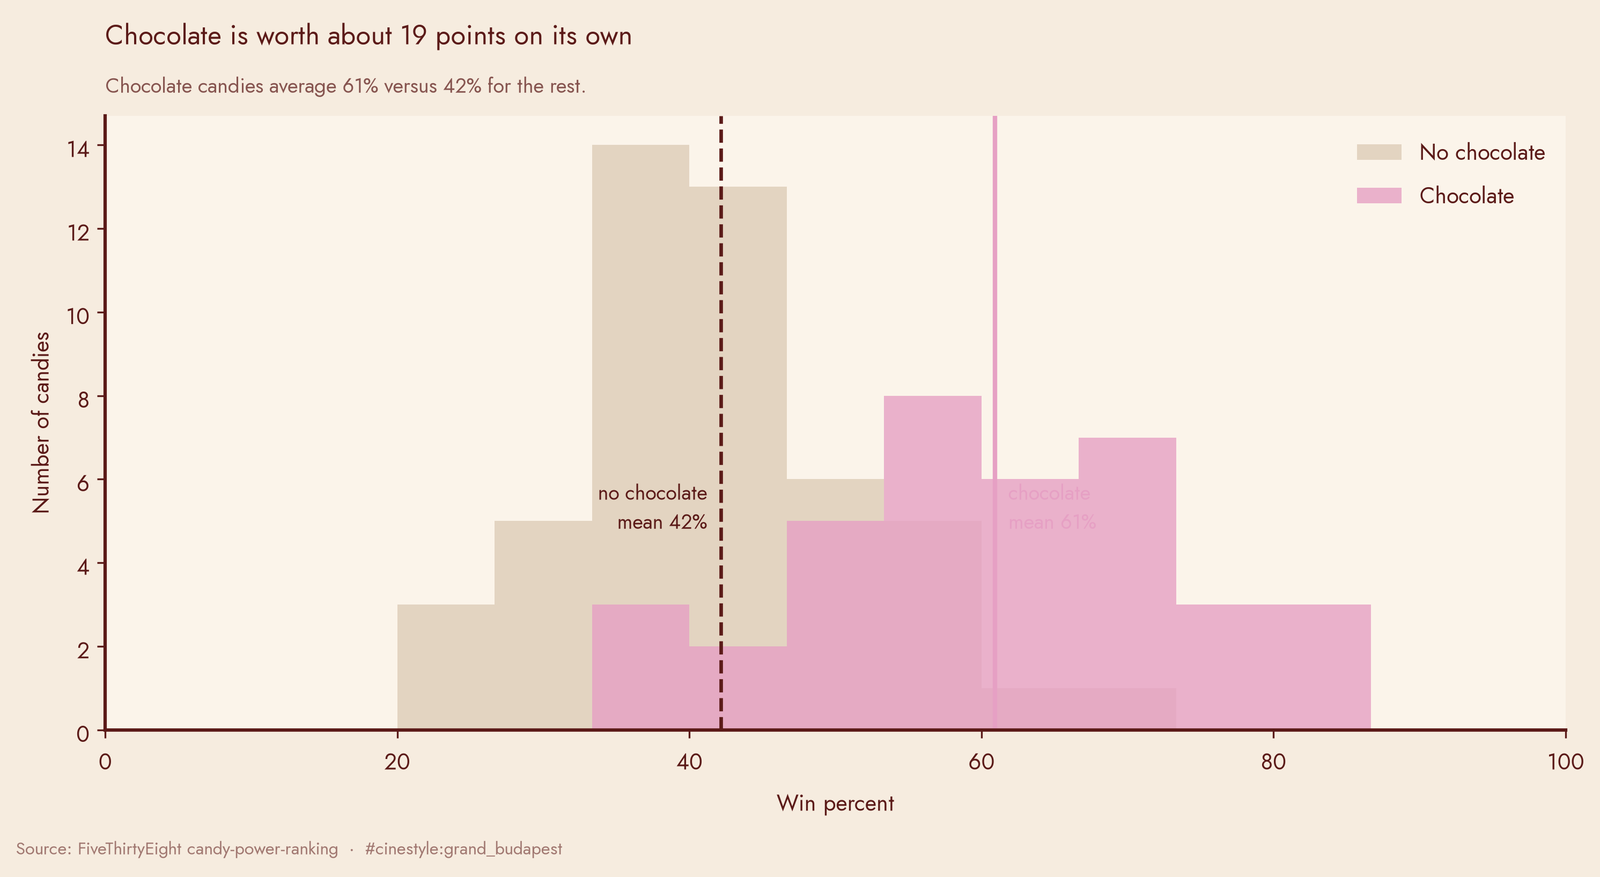
Chocolate candies average 60.9% win percent. Everything else averages 42.1%. That is an 18.8-point gap from a single binary trait, and it lines up almost exactly with the regression coefficient of 19.7. Fruity runs the opposite way: fruity candies average 44.1% against 55.3% for the rest, but most fruity candies are also the cheap non-chocolate novelties, so that raw gap is partly chocolate’s absence wearing a fruit costume.
Does paying more buy a winner
Only a little. Win percent correlates with price percentile at 0.34, a real but loose relationship. Pricier candy does tend to win more.
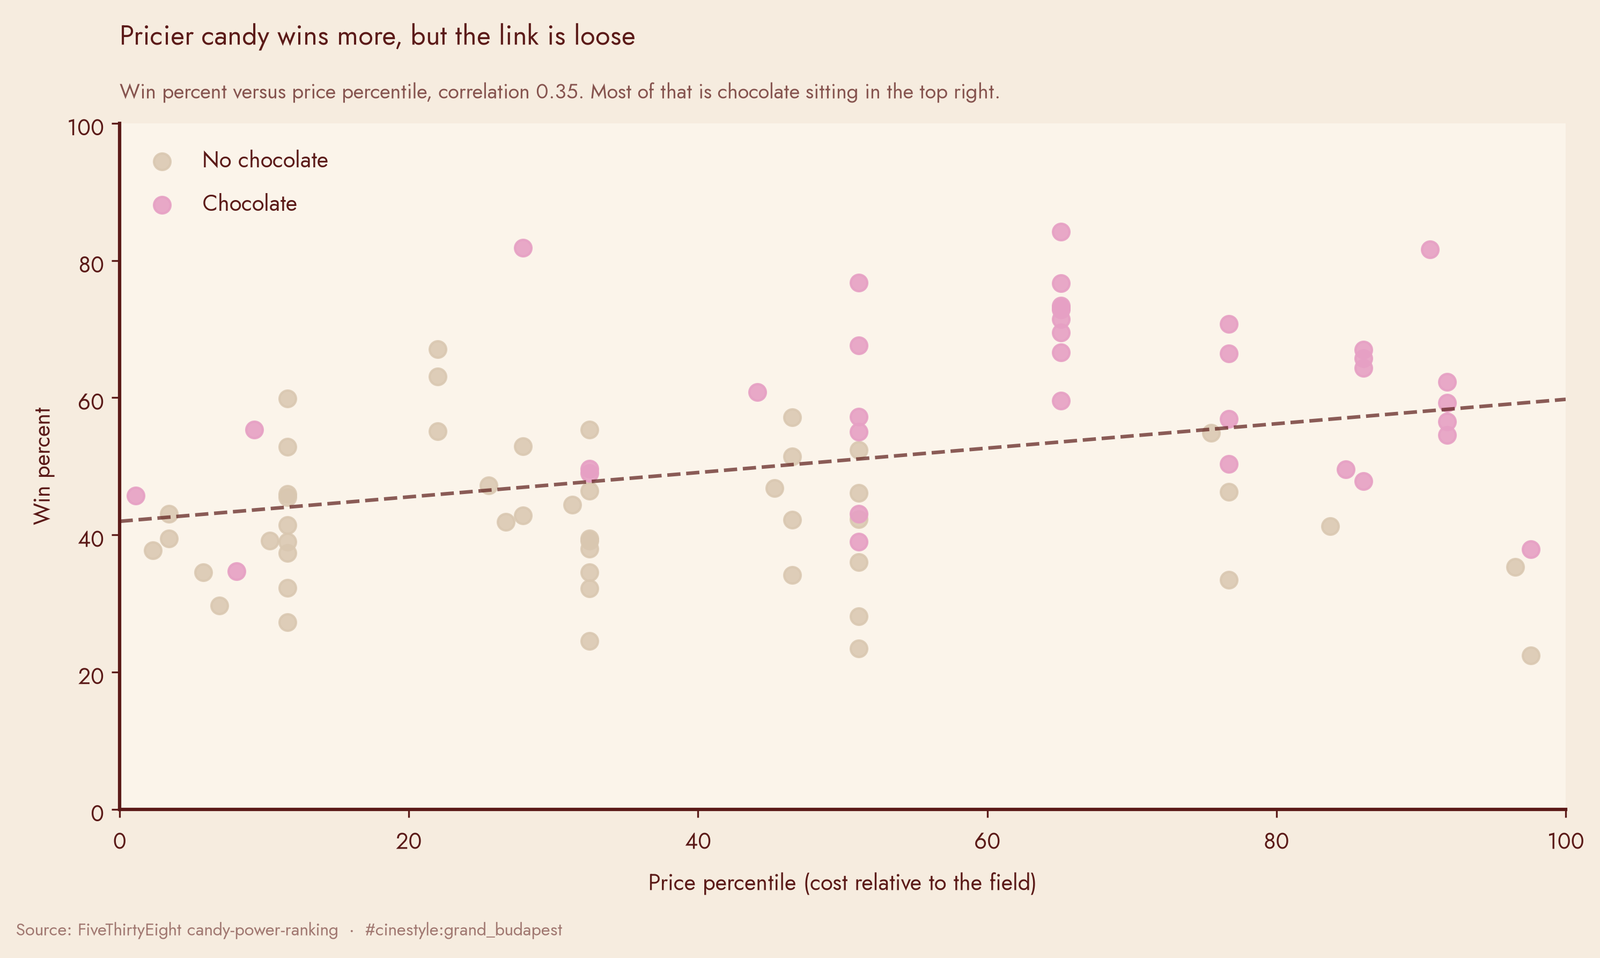
Look at where the chocolate dots land and the mechanism is obvious. The expensive, high-winning candies in the top right are almost all chocolate. Price is not buying wins directly. In the regression, with chocolate and the other traits held fixed, price percentile carries -5.9 points (t = -1.08): no help at all. Price and wins are both downstream of chocolate, which costs more to make and also tastes better to most people. Sugar is less simple than its raw correlation suggests. Win percent correlates with sugar percentile at only 0.23, and sugar and price correlate at 0.33, but once the other traits are held fixed sugar carries +9.1 points, just short of significance. Sweeter is probably a little better.
The verdict
I came in expecting the data to muddy a bar-stool argument with caveats. It did the opposite. One trait, chocolate, moves win percent by twenty points and explains most of the ranking. Peanut and almond stack on top of it. Everything people fixate on, bar versus pieces, nougat, caramel, price, either rides on chocolate or barely registers. The dime beating a handful of candies is the joke, but the real finding is plainer than the joke. Buy the chocolate, and if you can, buy the chocolate with a peanut in it.