// article
The Aging of Congress
Congress got older, but it took a detour first
The members of the 80th Congress, sworn in in 1947, had a median age of 51.9. The 113th, sworn in in 2013, had a median age of 58.05. Between those two points the line did not run straight up. It fell for about a quarter century, bottomed out in 1981, and only then began the climb that everyone remembers. The aging is real, but it came after a long decline.
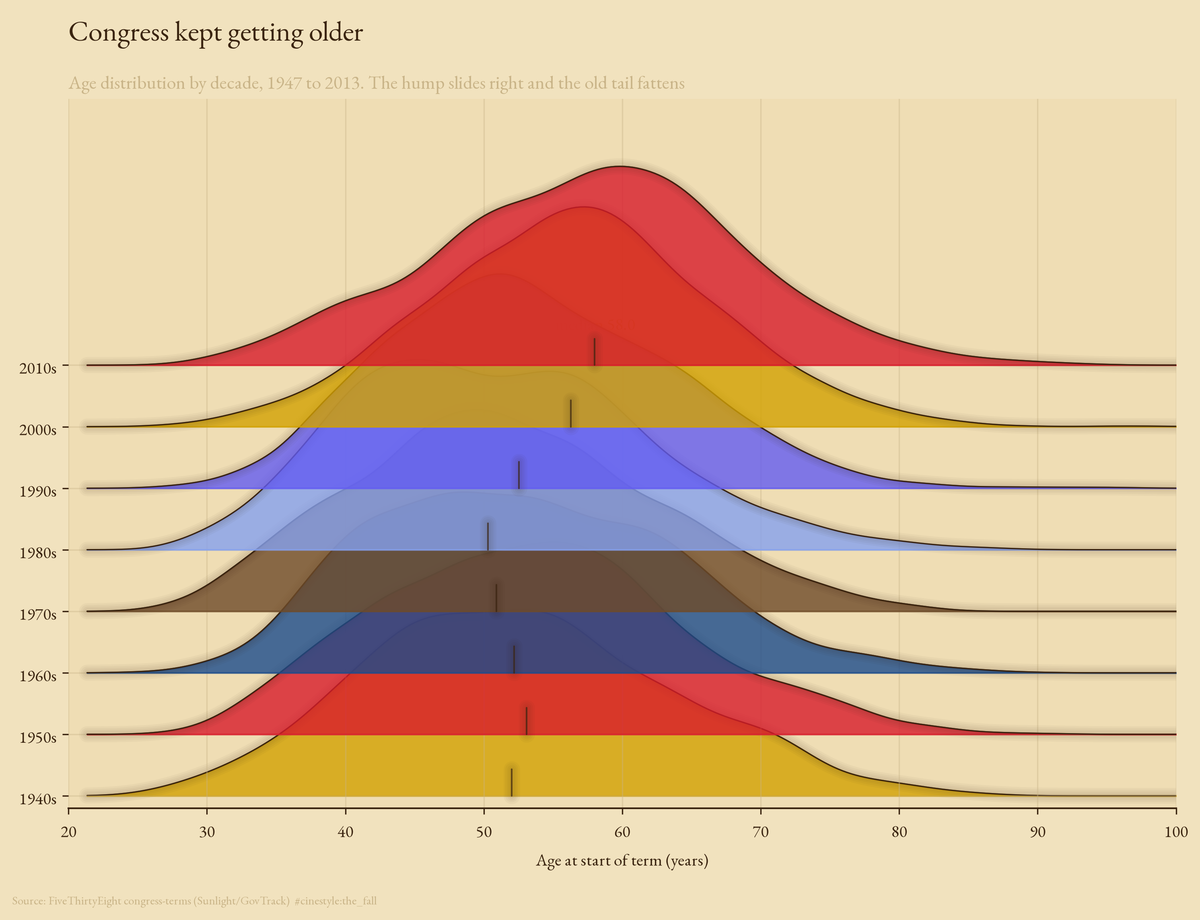
Each ridge above is one decade’s full spread of member ages at the start of a term. Read bottom to top and the whole hump drifts to the right while its right shoulder fattens.
The data is FiveThirtyEight’s congress-terms file, originally assembled from Sunlight Foundation and GovTrack records. It is 18,635 rows, one per member per term, covering 3,192 distinct people across Congresses 80 through 113. Each row carries an age computed at the term start date, so no cleaning or imputation was needed.
One thing to know about the unit. Every statistic below pools member-terms, not people. A member who served five terms in a decade counts five times in that decade’s median, which is why a full decade holds about 2,720 to 2,757 rows while the whole record has only 3,192 distinct members. That is the right unit for asking how old the body was when it sat, and the wrong one for asking how old the typical politician was.
The median fell before it climbed
Fit nothing, just plot the median age of each Congress against its year, and the shape is a long valley.
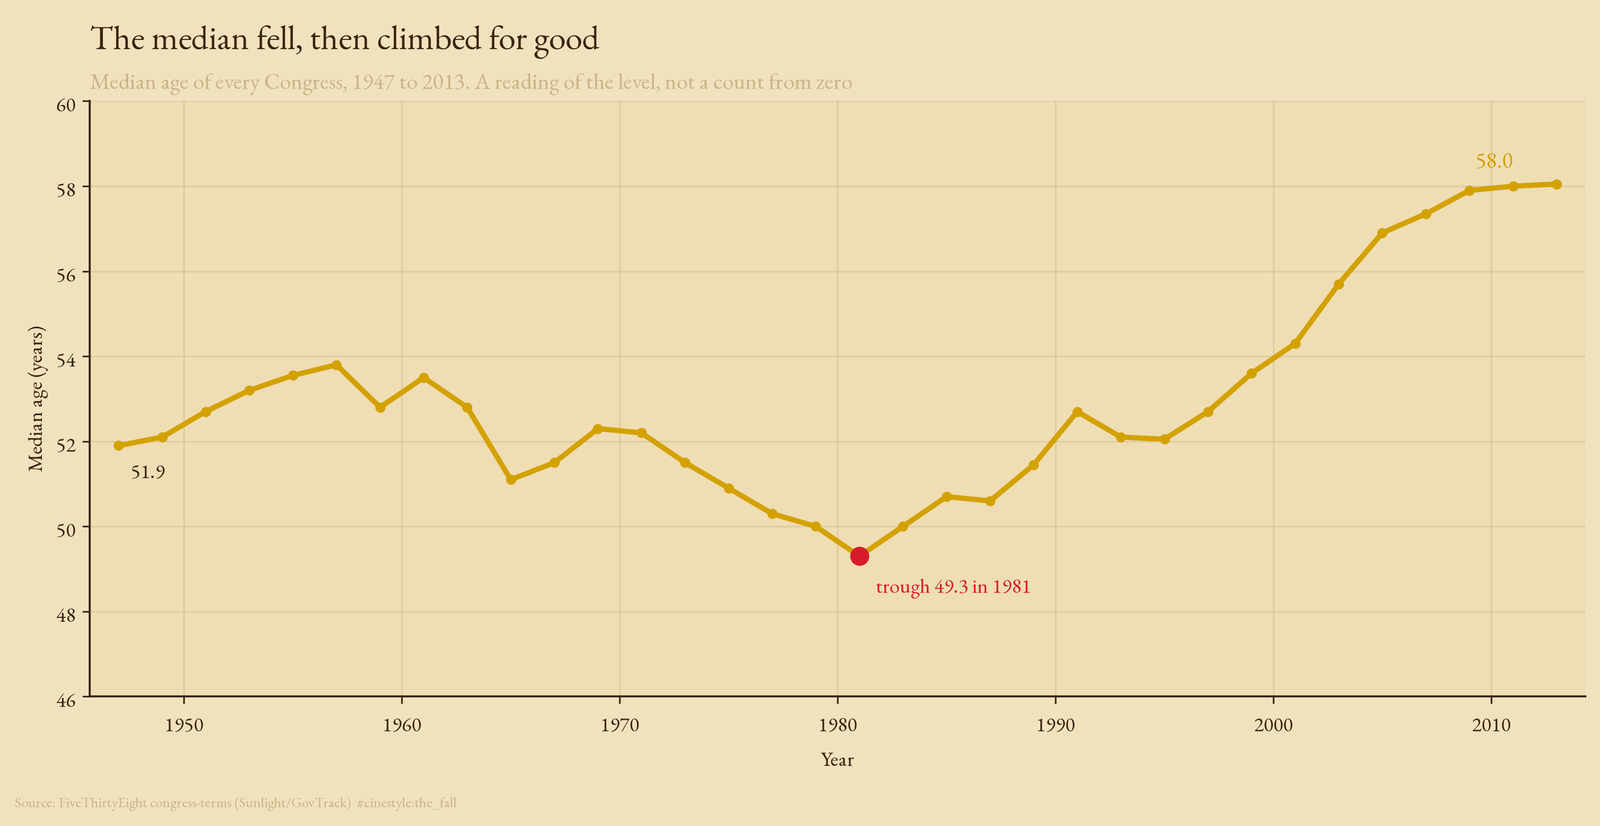
The high point of the early record is the late 1950s. From there the median slides down for a quarter century until it hits the floor: the 97th Congress, seated in 1981, had a median age of 49.3, the youngest in the whole record. Then it turns and climbs without a serious pause to 58.05 by 2013.
So the headline rise of 6.15 years across the record understates the real move. Measured from the 1981 trough, the median gained 8.75 years in three decades. The body got younger, stalled at its youngest, and then aged faster than the long average suggests.
The decades, side by side
Group the same ages by decade and the drift is unmistakable.
- 1940s: 52.0
- 1950s: 53.1
- 1960s: 52.2
- 1970s: 50.9
- 1980s: 50.3
- 1990s: 52.55
- 2000s: 56.3
- 2010s: 58.0
The first six decades sit between 50.3 and 53.1. The 2000s and 2010s break out of that band at 56.3 and 58.0. The 1980s is the floor at 50.3; the 2010s is the ceiling at 58.0. That is a 7.7-year gap between two decades of the same institution, and it opened in the span of a single working life. The ridgeline puts the same numbers in shape: the lower decades all peak near fifty, and only the top two ridges plant their peaks past it.
The two end decades are partial. The 1940s holds only 1947 and 1949, 1,112 rows, and the 2010s only 2011 and 2013, 1,091 rows. Read their medians as two Congresses each, not ten years.
The Senate stayed older the whole way
Split the record by chamber and one fact holds from the first Congress to the last: the Senate is older.
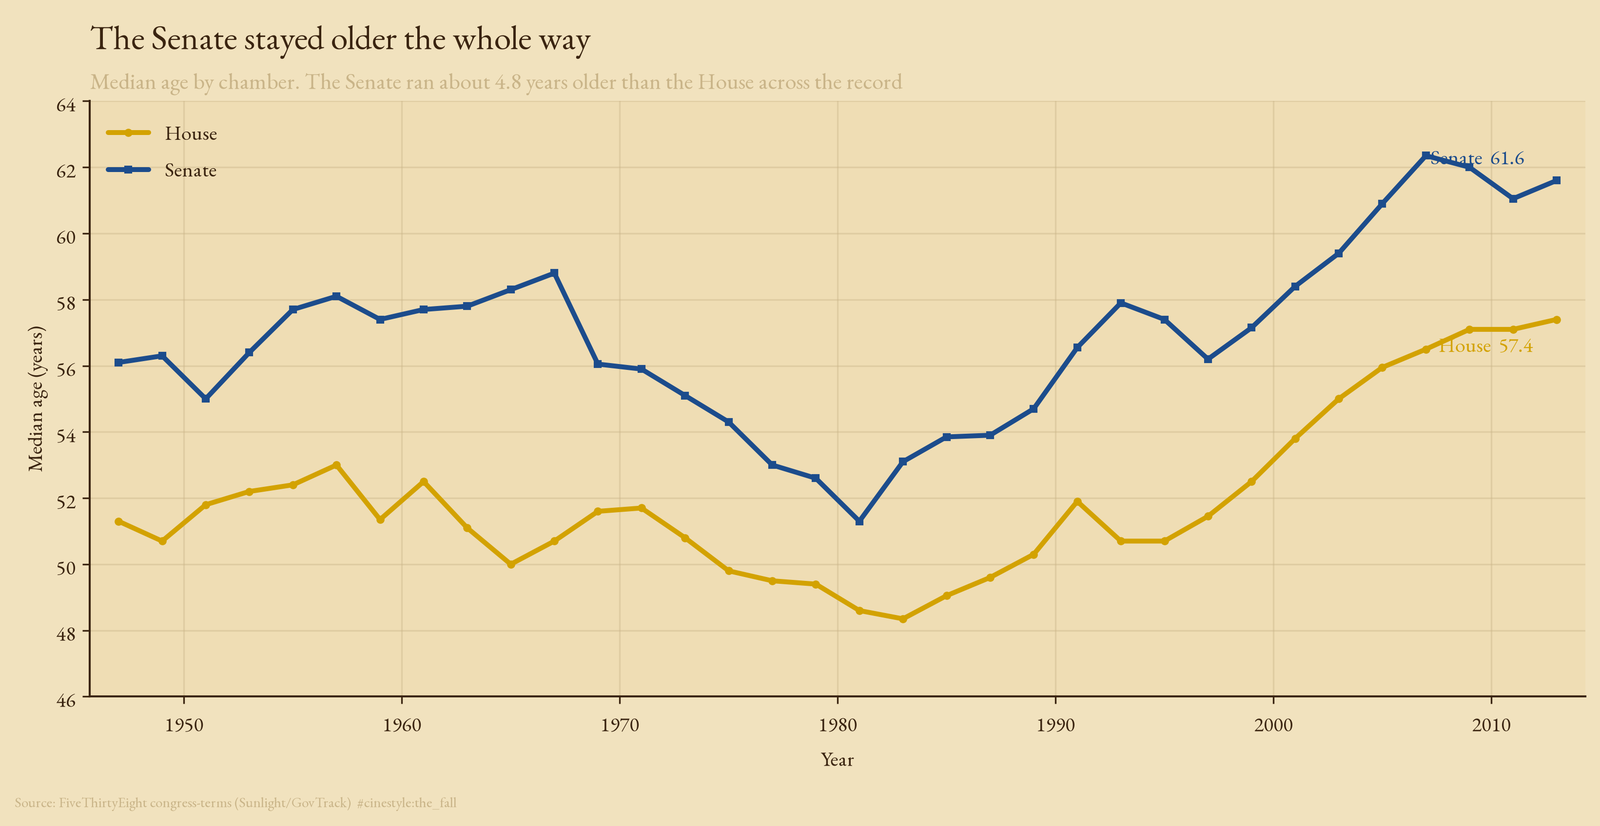
Across the full record the House median is 52.0 and the Senate median is 56.8, a gap of 4.8 years. Both chambers trace the same valley, falling into the 1980s and climbing back out, but the Senate rides above the House the entire time. By the end the House median reaches 57.4 and the Senate 61.6.
That gap is structural, not accidental. Senators serve six-year terms to a representative’s two, run statewide rather than in a district, and face the voters a third as often. A body that turns over more slowly and demands more standing to enter will skew older. The Senate lead is expected; its steadiness through both the valley and the climb is not.
The oldest cohort more than doubled
A rising median can hide where the weight moved. So I counted the share of each decade’s members who were at least 65 at the start of a term.
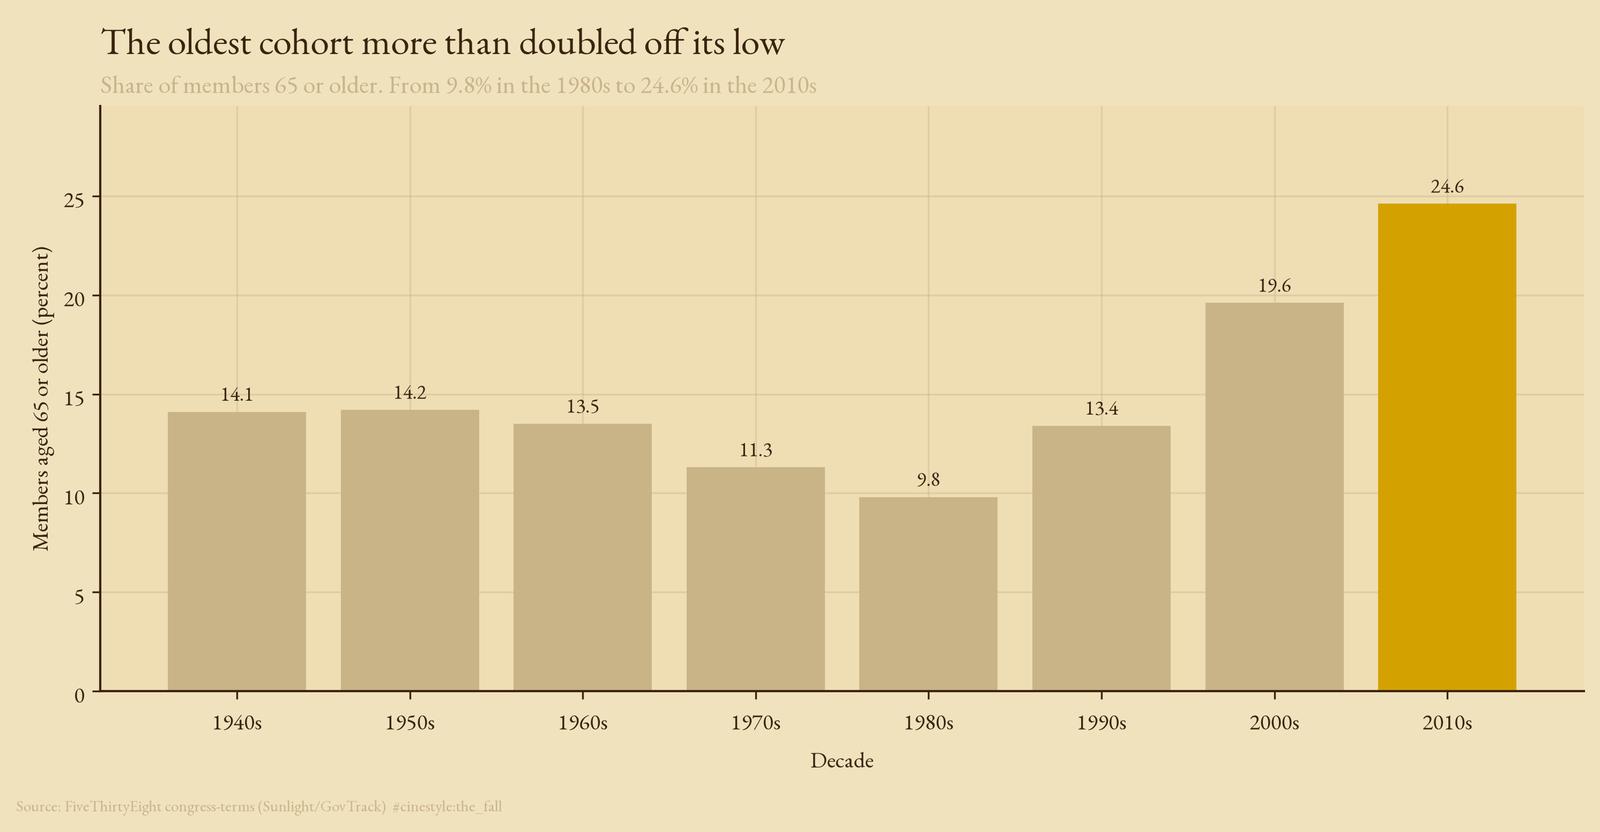
The 65-and-older share follows the same valley as the median, only sharper. It runs around 14% in the 1940s and 1950s, thins to 9.8% in the 1980s, and then climbs to 24.6% by the 2010s. The deepest cut and the highest peak are both in the modern data, two and a half times apart. The over-70 group, decade by decade, runs 7.0%, 7.7%, 6.0%, 4.9%, 4.7%, 5.5%, 9.0%, and 11.9%. It bottoms in the same decade and ends at two and a half times its low.
This is the fat right tail in the flagship made into a single number. The aging of Congress is not the whole distribution sliding up by a few years. It is the old end of the room filling in. One member in four now starts a term at an age when most Americans have left the workforce.
Where this record stops
This record stops in 2013, with the 113th Congress, and ages are measured at the start of each term rather than continuously. So a member who entered young and stayed for decades is counted at each fresh swearing-in, which is the right unit for asking how old the body is at any given moment but not for asking how long anyone served. The real-world numbers have kept climbing since 2013, so if anything the trend here is the conservative version of where Congress now sits.
I went looking for a line that aged steadily and found a valley with a sharp climb out the far side. The institution got younger through the 1970s, bottomed in 1981, and has been getting older ever since, fastest at the very top of the age range. The steady-aging story is comfortable, and the data does not support it.