// article
Disease in the Crimea
In the Crimea, disease killed eight soldiers for every one the enemy did
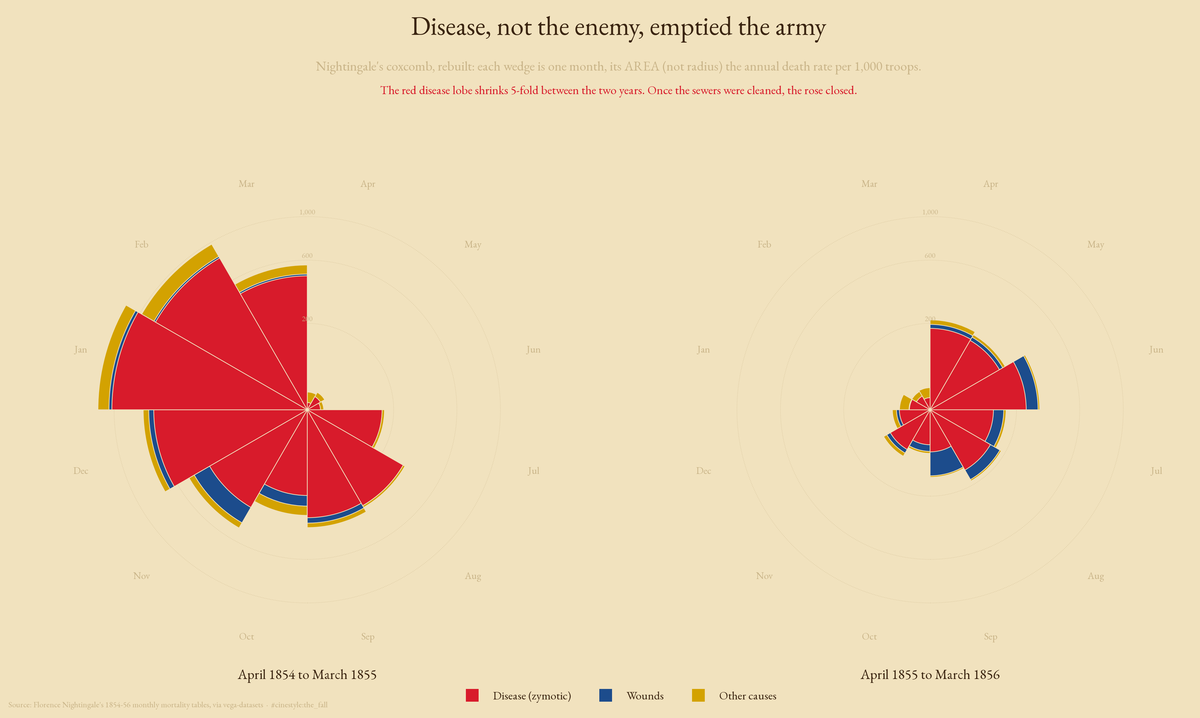
For every British soldier who died of his wounds in the Crimean War, eight died of disease. That ratio holds across the whole war, not just the worst months.
That is the number that made me stop and re-run the sum. I had Florence Nightingale’s own monthly death tables in front of me, the same figures she fed into her famous coxcomb diagram, and I expected combat to at least be in the same league as cholera and dysentery. It is not close. Over the 24 months from April 1854 to March 1856, the army lost 1,758 men to wounds and 14,476 to disease. Add the 1,748 from “other” causes and disease alone is 80.5% of every death in the dataset.
I rebuilt the coxcomb above from those numbers rather than copying her plate: same construction, area not radius carrying the rate, the two years she drew side by side. Picture the red lobe as a bloom that opens with the death rate and closes as it falls. It is the one chart where you do not have to be told the answer.
The data is small and I want to be honest about that up front: 24 rows, five columns. A date, the army’s strength that month, and deaths split into wounds, disease, and other. It comes from Nightingale’s monthly mortality figures for 1854 to 1856, the same series she later published in her 1858 report to the government, distributed now through the vega-datasets collection. No raw case records, no individual soldiers, just monthly totals. Those totals were enough for her to win an argument with the British government, and they are enough to reconstruct that argument from scratch.
Counting bodies is not the same as measuring danger
A raw death count hides the thing you actually care about, which is how dangerous it was to be a soldier in a given month. Eight hundred disease deaths out of thirty thousand men is a different situation than eight hundred out of eight thousand. The army’s size swung wildly, from 8,571 men in April 1854 up to a peak of 47,751 by September 1855, so the counts and the risk pull apart.
Nightingale’s fix was to annualise. Take the deaths in a month, divide by the troops present, then multiply by twelve and by a thousand. The result is deaths per 1,000 troops per year, the rate you would see if that month repeated for a year. That single division is the move that turns a body count into a mortality rate, and it is why her tables persuaded people who did not care about arithmetic.
Run it on the worst month and the number is hard to believe. January 1855: 2,761 men dead of disease out of 32,393 present. Annualised, that is 1,022.8 deaths per 1,000 troops per year. Read it literally and it says the disease deaths in that single month, sustained for a year, would have killed more men than were in the army. Add wounds and other causes and the all-cause rate that January hits 1,173.6 per 1,000. For one month the army was dying faster than it could theoretically be wiped out.
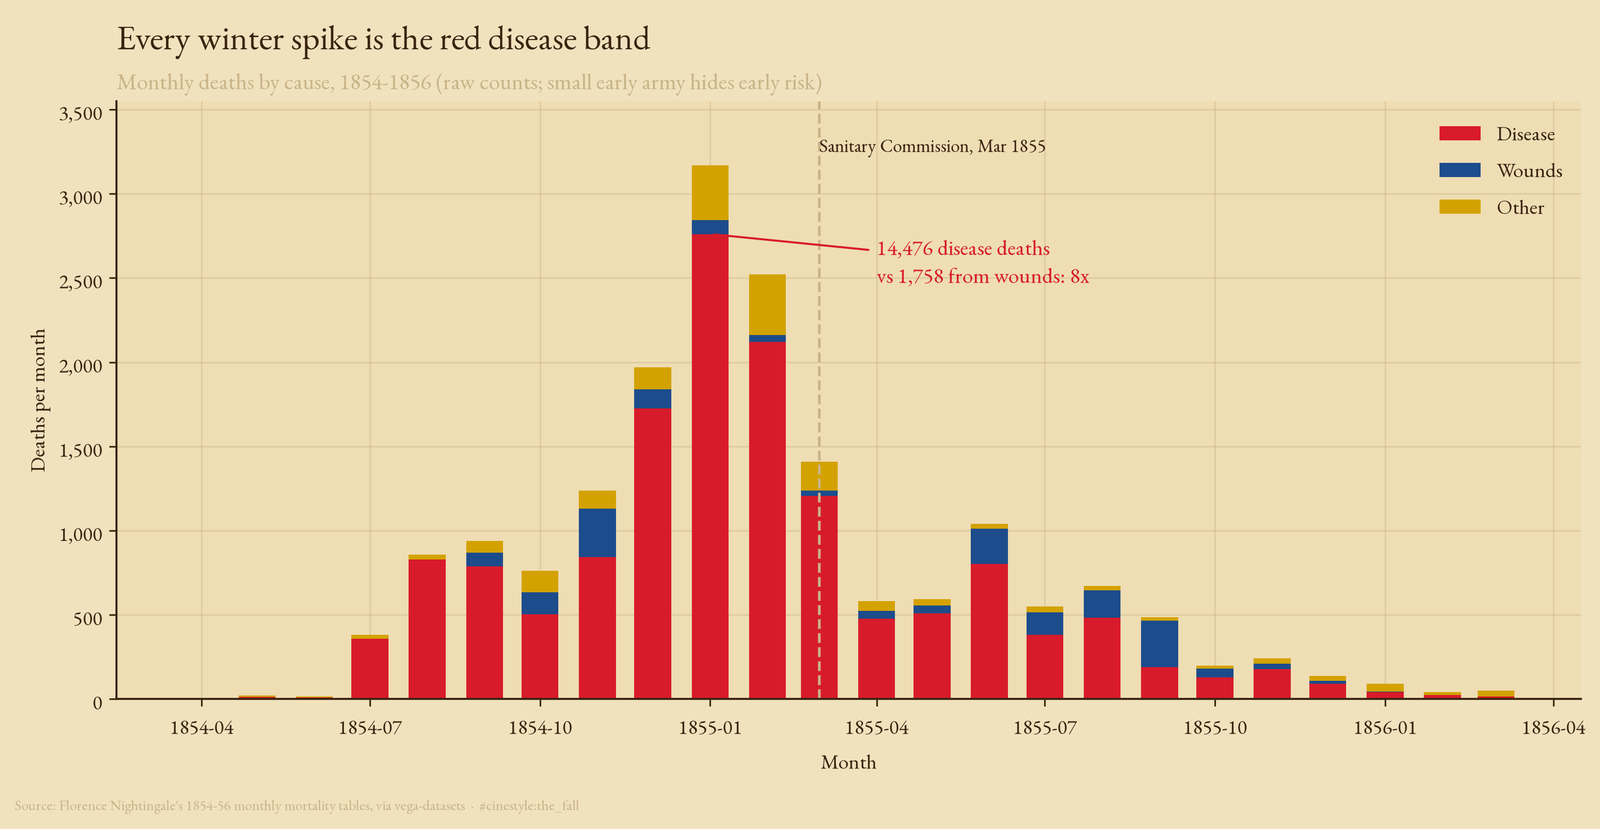
The stacked chart makes the imbalance obvious: the red disease band swamps everything. The bars are raw counts, and the army grew from 8,571 men to a peak of 47,751, so the same count meant more risk early in the war than late. A count chart undersells the early misery.
The turning point
The part of Nightingale’s case that is easy to forget is this: the catastrophe did not just burn itself out. Something changed it.
In March 1855 a Sanitary Commission arrived at the British hospital at Scutari and started doing unglamorous things. It cleared the sewers under the wards, flushed the water supply, and hauled out the dead animals that had been fouling it. Split the data at that month, pool the deaths and the troop-strength on either side, and the disease mortality rate goes from 398.4 per 1,000 per year before to 79.1 after, a five-fold drop. The all-cause rate falls from 474.7 to 111.8 over the same line.
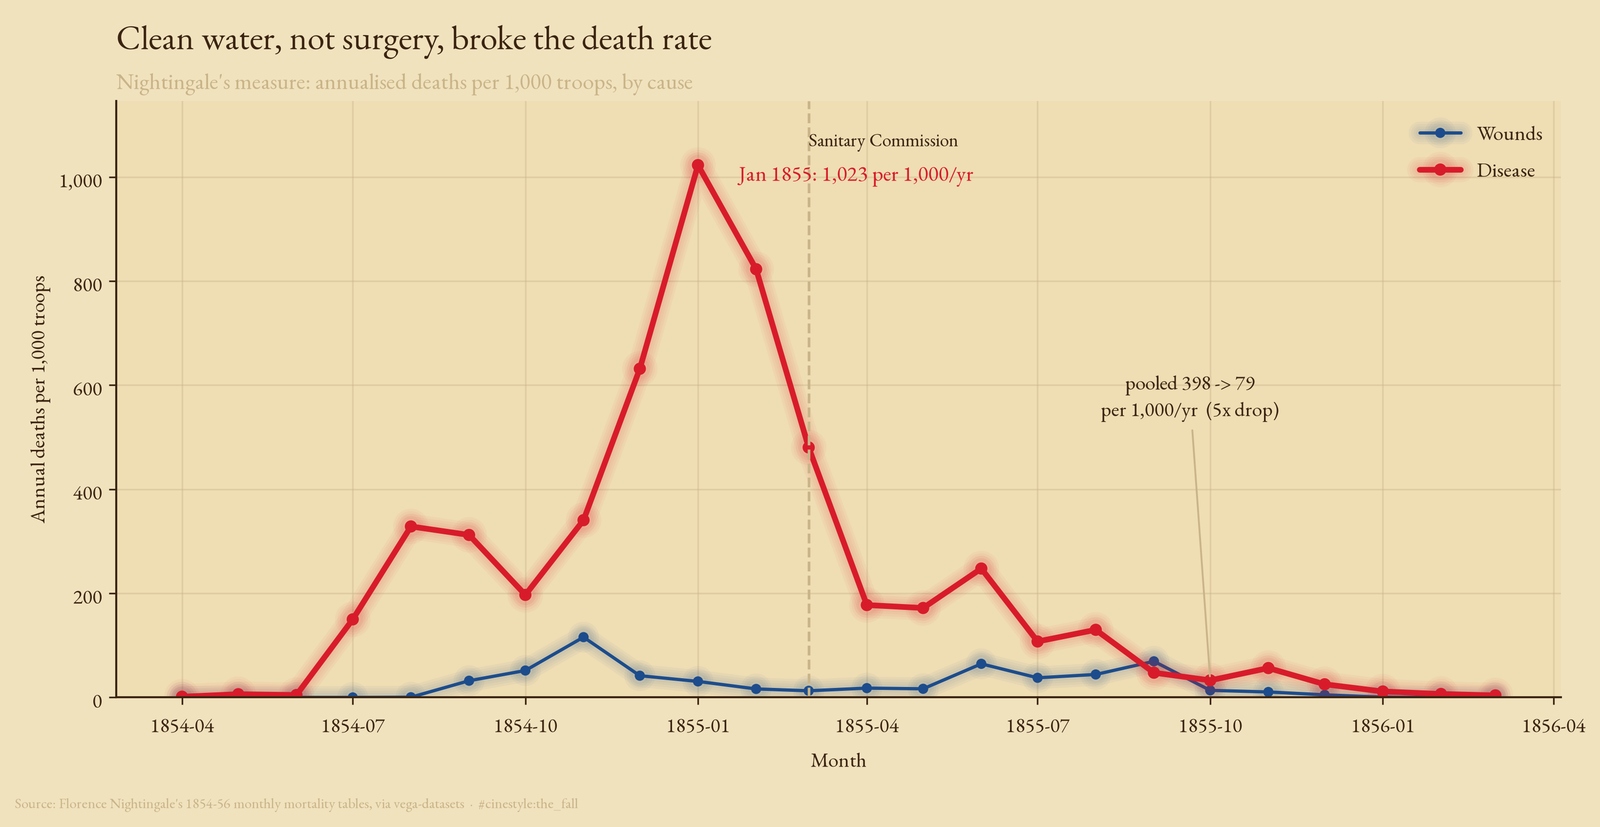
The rate chart is where I would point anyone who still thinks this was about brave surgery. The disease line spikes over the first winter, crosses the March 1855 marker, then flattens against the floor for the rest of the war. The wounds line barely moves, and combat never came close to disease.
This is not a clean experiment. The Sanitary Commission arrived in March, but spring also arrived in March. The brutal first Crimean winter, with its frostbite and frozen supply lines and no shelter, was ending at exactly the moment the engineers showed up. Some of that five-fold fall is sanitation and some of it is the thaw, and 24 months of pooled monthly totals cannot separate the two. Without a control army, the before-and-after is suggestive, not proof; Nightingale did not have one either.
What the data does say cleanly is the thing she led with, and it survives every way I slice it: the enemy was almost beside the point. A soldier in the Crimea was eight times more likely to die of disease than of a wound, the deadliest month ran past the entire army’s strength, and the disease rate fell five-fold after the Sanitary Commission arrived, as the first winter ended. You do not have to read her rose to believe it. You only need the soldiers counted, and divided by how many were standing there to be killed.