// article
Evidence and Perception
Stronger evidence does not raise the signal; it splits it
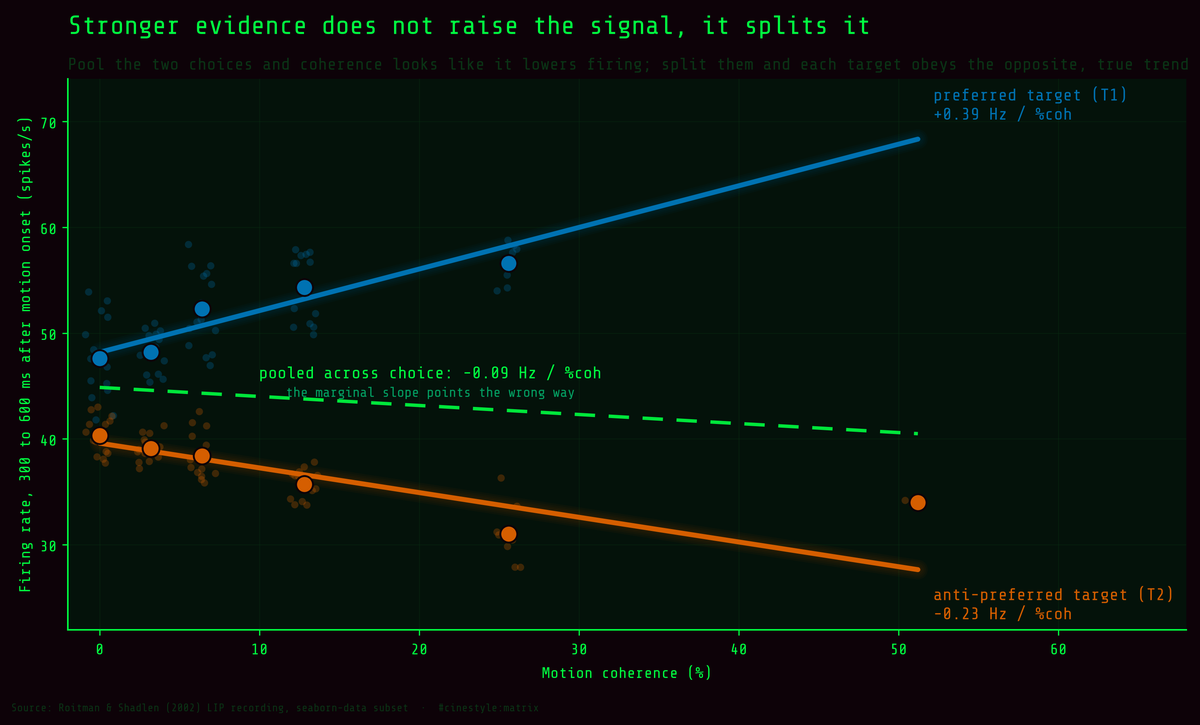
In this recording, the choice moves the neuron more than the stimulus does. Pool the two choices together and coherence looks like it quietly lowers the neuron’s firing. Split the rows by which target the monkey picked and the picture reverses: each choice follows its own trend, in opposite directions, and the pooled line is the average of two things going different ways. It is a textbook Simpson’s paradox, and you can watch it happen on a single recording.
Late in the trial, the firing rate on trials where the monkey chose the preferred target sat at 51.1 spikes per second. When it chose the other target, it sat at 37.5. That 13.6 Hz gap, measured 300 to 600 ms after the dots started moving, is the cleanest number in this dataset, and I assumed at first that it had nothing to do with how strong the motion was.
I pulled the dots set that ships with seaborn. It is a packaged demo subset of the Roitman & Shadlen 2002 random-dot motion recordings from area LIP. 848 rows, five columns: align, choice, time, coherence, firing_rate. The monkey watches a cloud of dots, some fraction moving coherently in one direction, and saccades to one of two targets to report which way. coherence is that fraction: 0, 3.2, 6.4, 12.8, 25.6, or 51.2 percent. choice is T1 or T2, the two targets. align splits the recording into two epochs: dots is locked to motion onset, sacc is locked to the eye movement. time runs from -600 to 720 ms across 67 bins. firing_rate is in spikes per second.
One thing about the unit matters for everything below. Each row is not a trial. It is one time bin of an already-averaged firing rate for one combination of epoch, choice, and coherence. Adjacent bins are strongly dependent, so any p-value that treats the 848 rows as independent draws is far too small. Where I give p-values, they come from per-coherence means, one point per coherence level.
My hypothesis going in was the obvious one. More coherence means stronger evidence, so the signal should climb with coherence.
The pooled data says the opposite. Correlate firing rate against coherence across all 848 rows and you get a negative Pearson r of -0.13; the rank correlation is -0.19. Average firing drops from 40.9 Hz at 0% coherence to 36.2 Hz at 51.2%. That runs backwards from every textbook account of this experiment.
The pooling was lying
The trap is choice. T1 is the neuron’s preferred target, the direction its receptive field cares about. T2 is the anti-preferred one. When you average across both, you are mixing a set that should go up with coherence and one that should go down, and the mixture depends on how many rows land in each bin.
So I split it. In the late stimulus window, 141 rows spanning 16 time bins, I fit firing rate against coherence separately for each choice:
- T1 (preferred): slope +0.39 Hz per percent coherence across rows. On the five per-coherence means, the slope is +0.36, r² = 0.87, p = 0.02.
- T2 (anti-preferred): slope -0.23 Hz per percent coherence across rows. On the six per-coherence means, the slope is -0.14, r² = 0.55, p = 0.09.
Coherence drives the two choices apart instead of pushing one global signal up or down. On preferred-target rows the rate climbs by roughly four-tenths of a spike per second for every extra percent of coherent motion. On anti-preferred rows it sinks, more weakly, and with six points that decline does not clear conventional significance. The pooled slope is negative however you cut it: -0.10 Hz per percent across all rows, -0.09 across late-window rows, and -0.20 through the six late-window bin means. All three come from the same artifact. The late window has no T1 rows at 51.2% coherence, so the highest-coherence point in the pooled average comes from T2 alone and drags the marginal down, even while each choice’s own slope behaves.
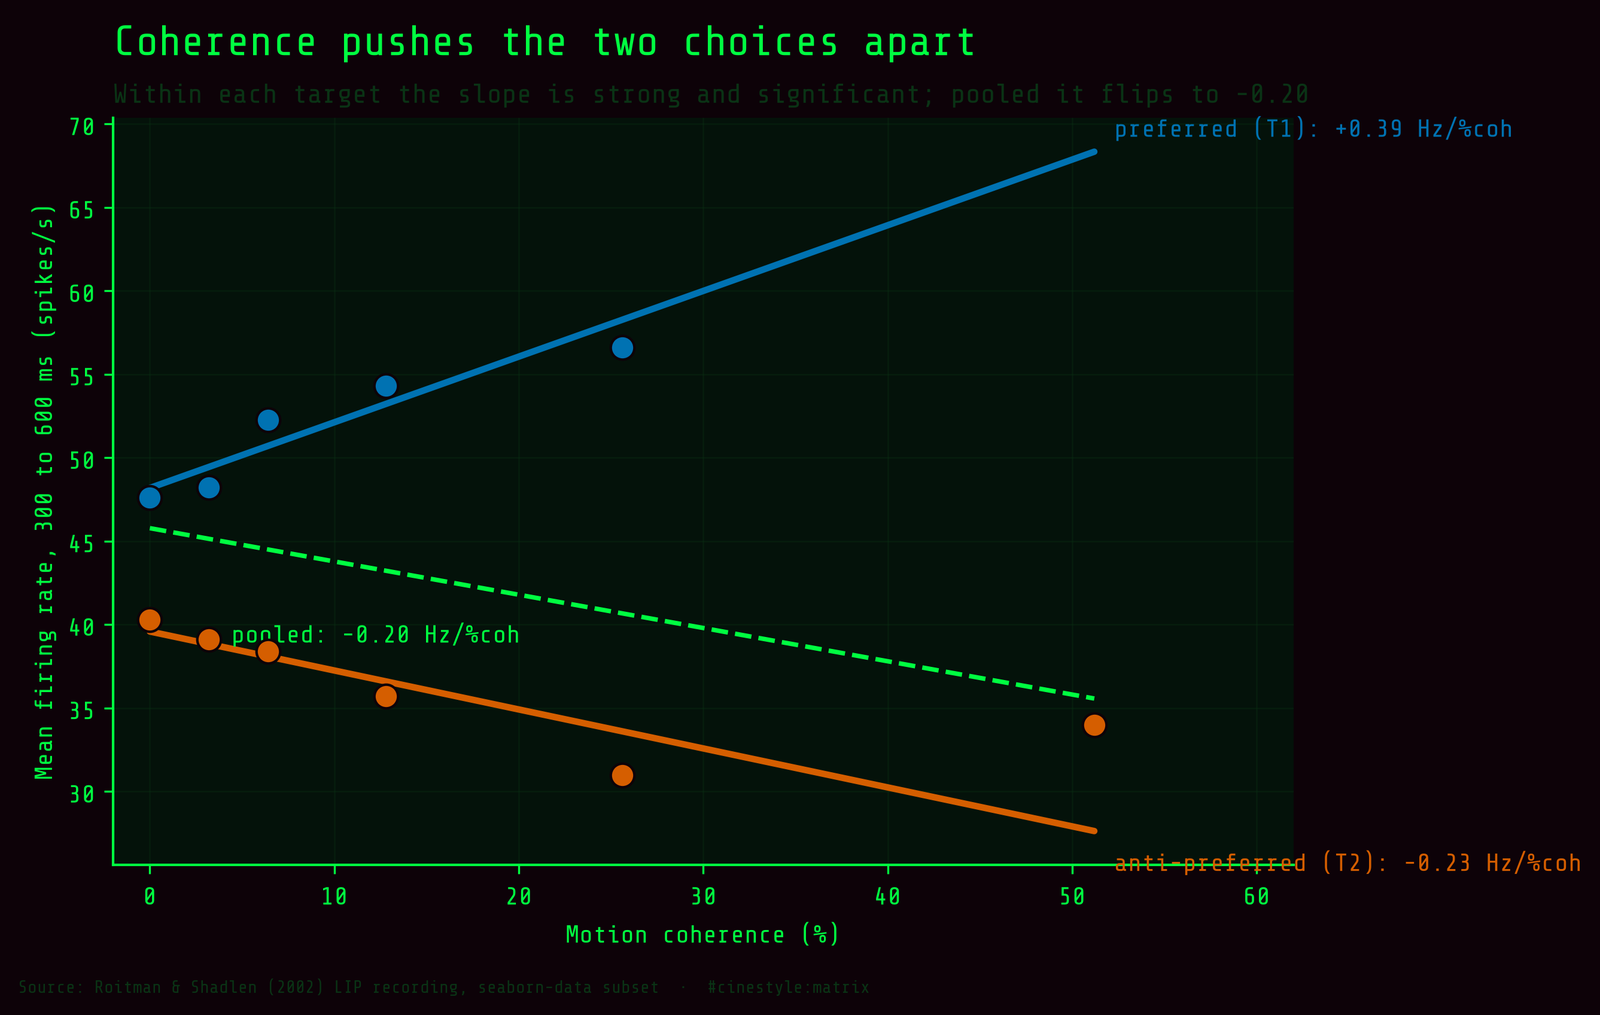
Two lines spread as you move right, and the dashed pooled fit through the six bin means slopes the wrong way through the middle. The T1 line stops at 25.6%. The preferred target does have 51.2% rows elsewhere in the recording, 19 time bins of them, just not in this window. That gap is part of why the pooled fit gets yanked downward at the right edge: the only 51.2% point left is the low T2 one. In a demo subset this small the bins are not balanced, and imbalanced bins are how a real trend hides inside a marginal that lies.
Evidence needs time to show up
Coherence is not visible the instant the dots appear. It accumulates. Picture the firing rate as a running tally that the neuron adds to with every moment of coherent motion it sees; at time zero the tally is empty no matter how strong the stimulus. I checked the early window, -80 to 80 ms around motion onset, and coherence explains essentially nothing there: r = 0.026, with a total spread of 0.86 Hz across all six coherence levels. The neuron has not separated yet because there has been no time to integrate evidence.
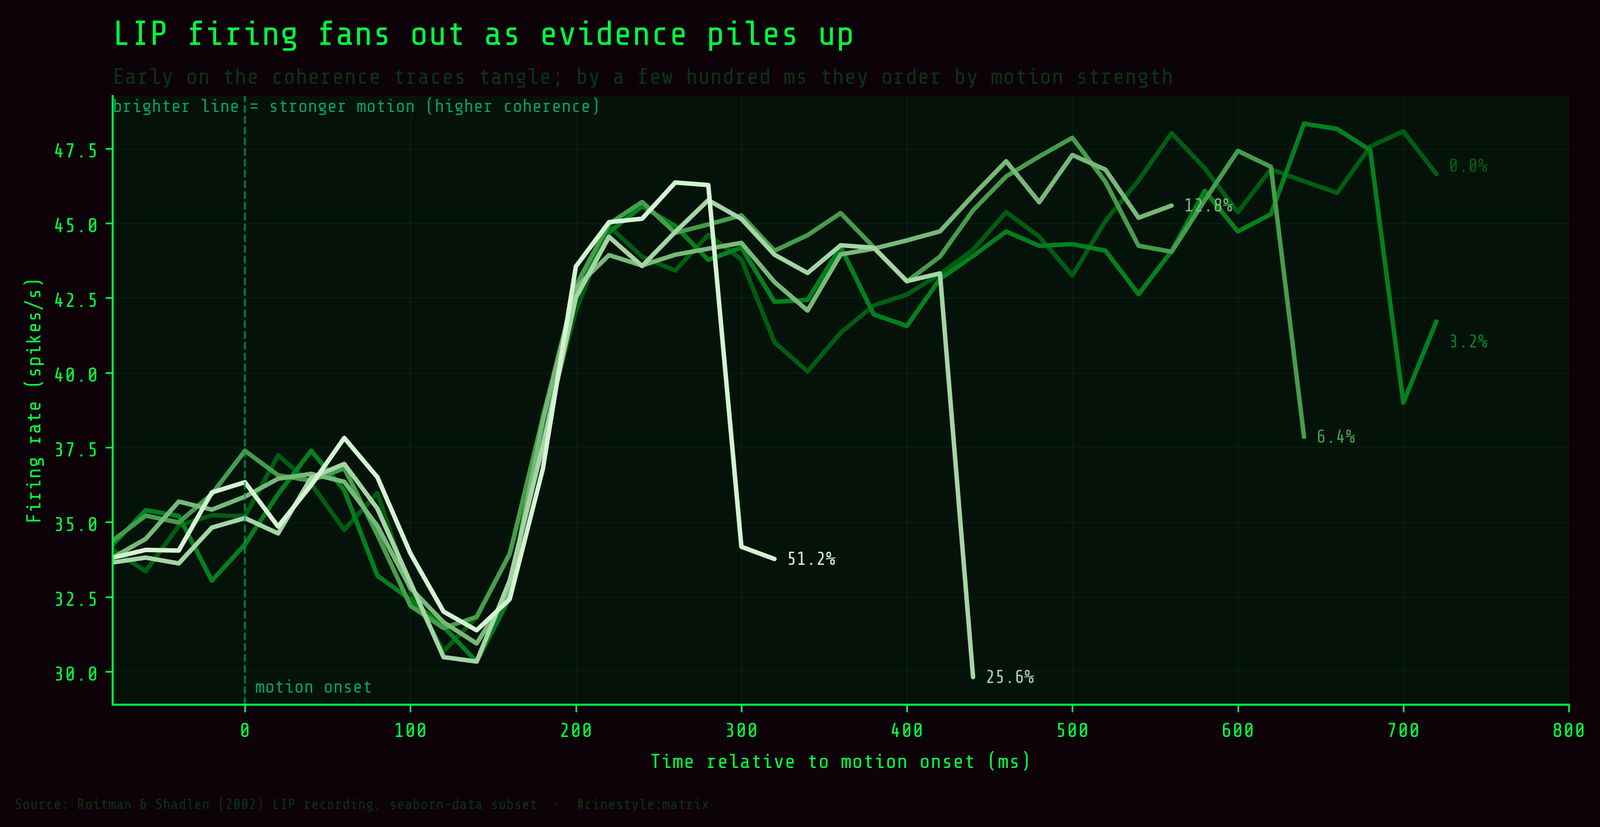
Watch the lines fan out as time runs forward. Early on they are a tangle. By a few hundred milliseconds in, the ordering is there, though it is the direction-collapsed ordering, which is why the fan in this plot looks noisier than the choice-split version above. This is the integration-to-bound picture people draw for LIP: the firing rate is a running tally of motion evidence, and stronger motion moves the tally faster. The choice gap grows the same way: averaged over the whole stimulus epoch it is 43.4 Hz against 37.2 Hz, about 6 Hz, less than half the 13.6 Hz gap in the late window.
What the neuron really tracks
If coherence sets the rate of evidence, choice is the outcome. The 13.6 Hz late-window gap between T1 and T2 dwarfs anything coherence does on its own. It holds level by level: at each of the five coherence levels both choices share, T1 fires at least 7.3 Hz above T2 (paired t = 4.48 on five levels, p = 0.011). Lock the recording to the saccade instead of to the motion, and you can see why.
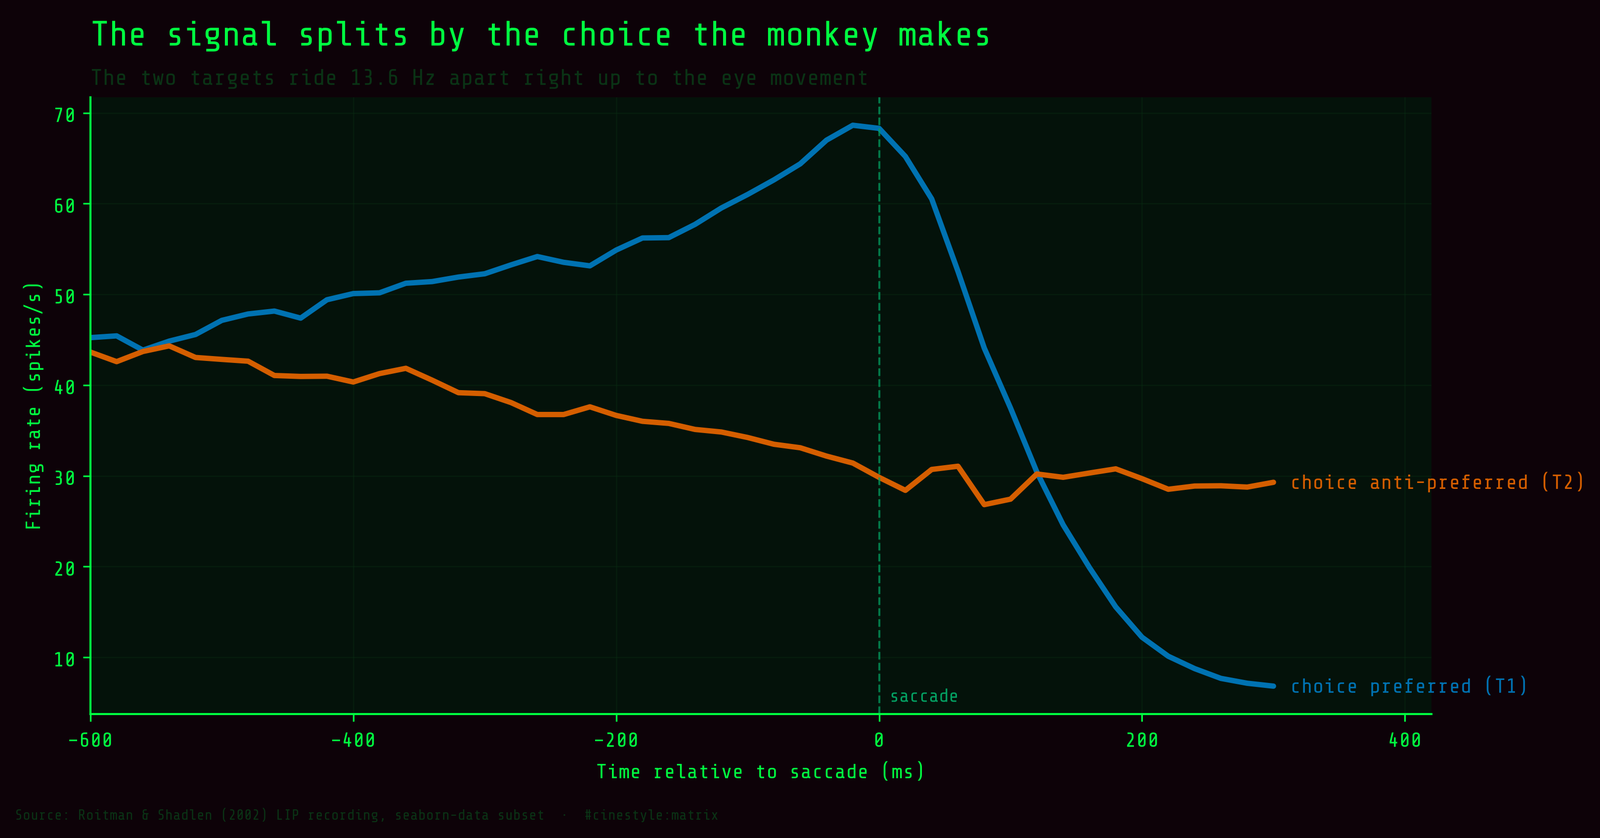
In the saccade-aligned epoch the two choice traces ride at clearly different levels right up to the eye movement at time zero. The neuron is not reporting “how strong was the motion” so much as “which target am I about to commit to.” Coherence sits upstream of that. It controls how fast and how confidently the commitment forms, but the variable the cell most cleanly encodes is the decision itself.
So the honest answer to “how cleanly does coherence drive the neural signal” is: clearly on the preferred side and weakly on the other, only once you condition on choice, and only after evidence has had a few hundred milliseconds to pile up. Take it raw and pooled, and coherence appears to lower the firing rate, which is the Simpson’s-paradox mirage a pooled plot produces.
The strongest signal in a perceptual-decision recording is the choice, not the stimulus; the stimulus sets how quickly the choice pulls away.