// article
The Air-Traffic Network
Ten airports own a third of US air traffic, and that is a design pattern I have shipped
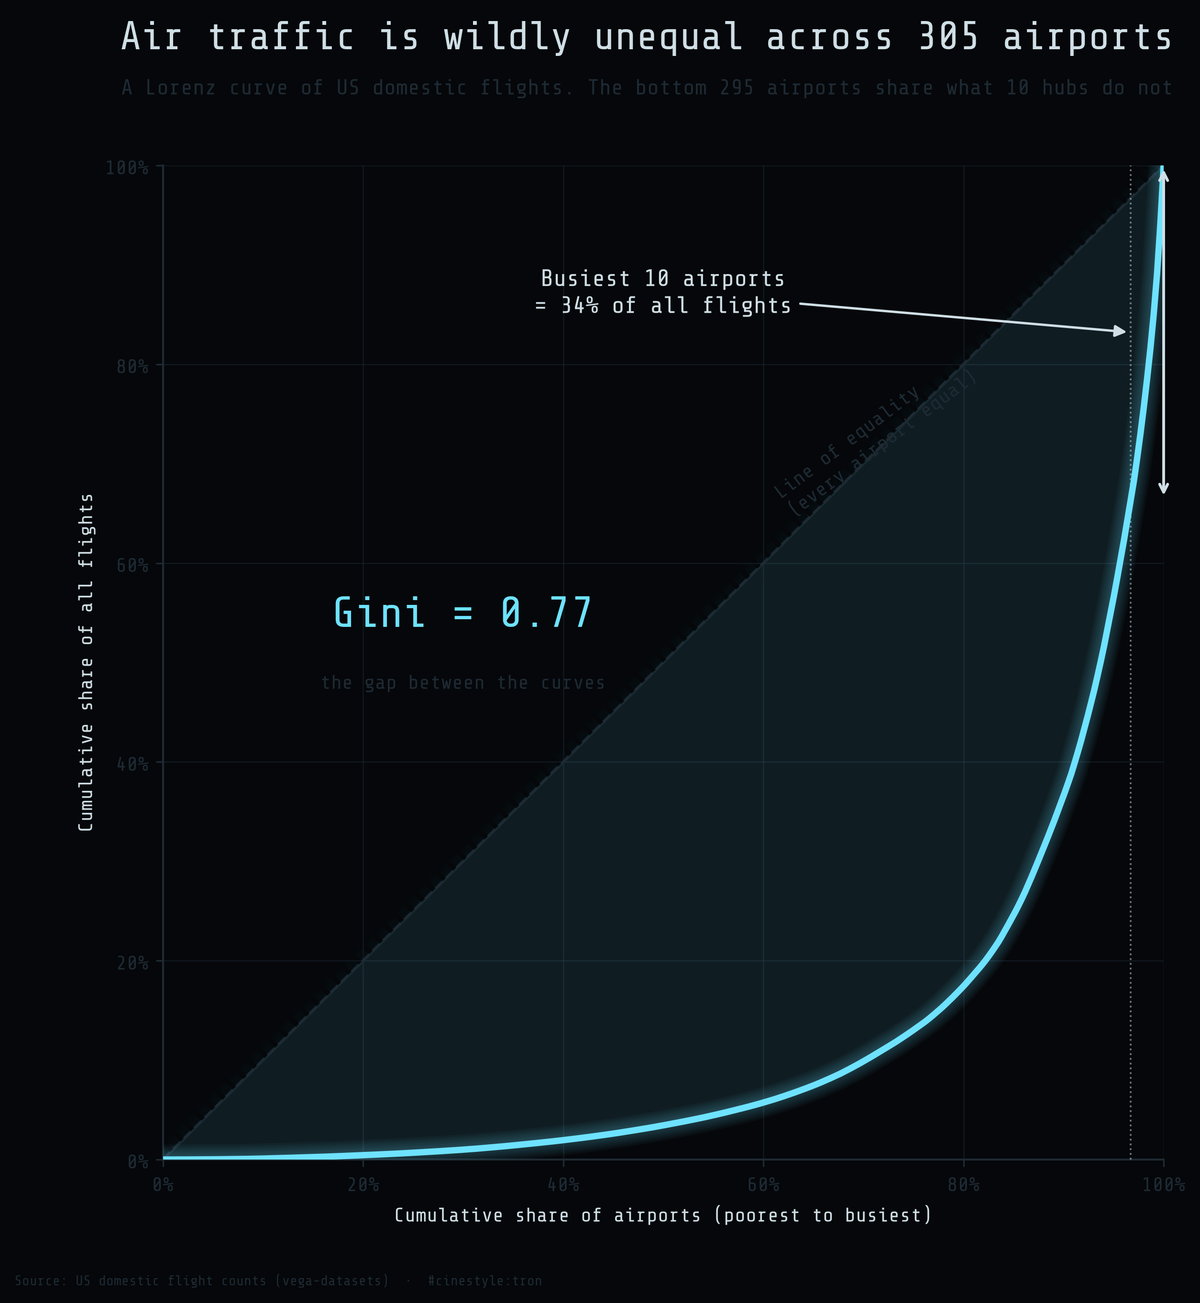
Ten airports out of 305 are the origin of 33.7% of every domestic flight in this dataset. That third counts every flight, not only the long-haul or high-value ones. The US flight network is the most heavily skewed real graph I have worked with outside a synthetic benchmark, and it encodes every hard lesson I have learned about hot partitions and blast radius.
The first time I ran that number I assumed I had double-counted something. I had not double-counted anything, and the skew is the real shape of the network. A Gini of 0.77 is the kind of figure you usually see in arguments about wealth, not runways.
The data
It is the airport-pair flight table from vega-datasets: 5,366 directed routes between 305 airports, three columns, origin, destination, and a flight count. Treat each airport as a node and each route as a weighted edge. That gives a directed graph with 7,009,728 flights riding on it. No networkx involved. This is groupby and a couple of set operations in pandas.
Every airport gets two numbers. Its degree, meaning how many distinct other airports it connects to, and its throughput, the total flights touching it as origin or destination. Picture a switchboard: degree is how many lines plug into it, throughput is how many calls run through. In a distributed system those are the two things you watch on a node before it becomes the reason you get paged.
The skew is brutal
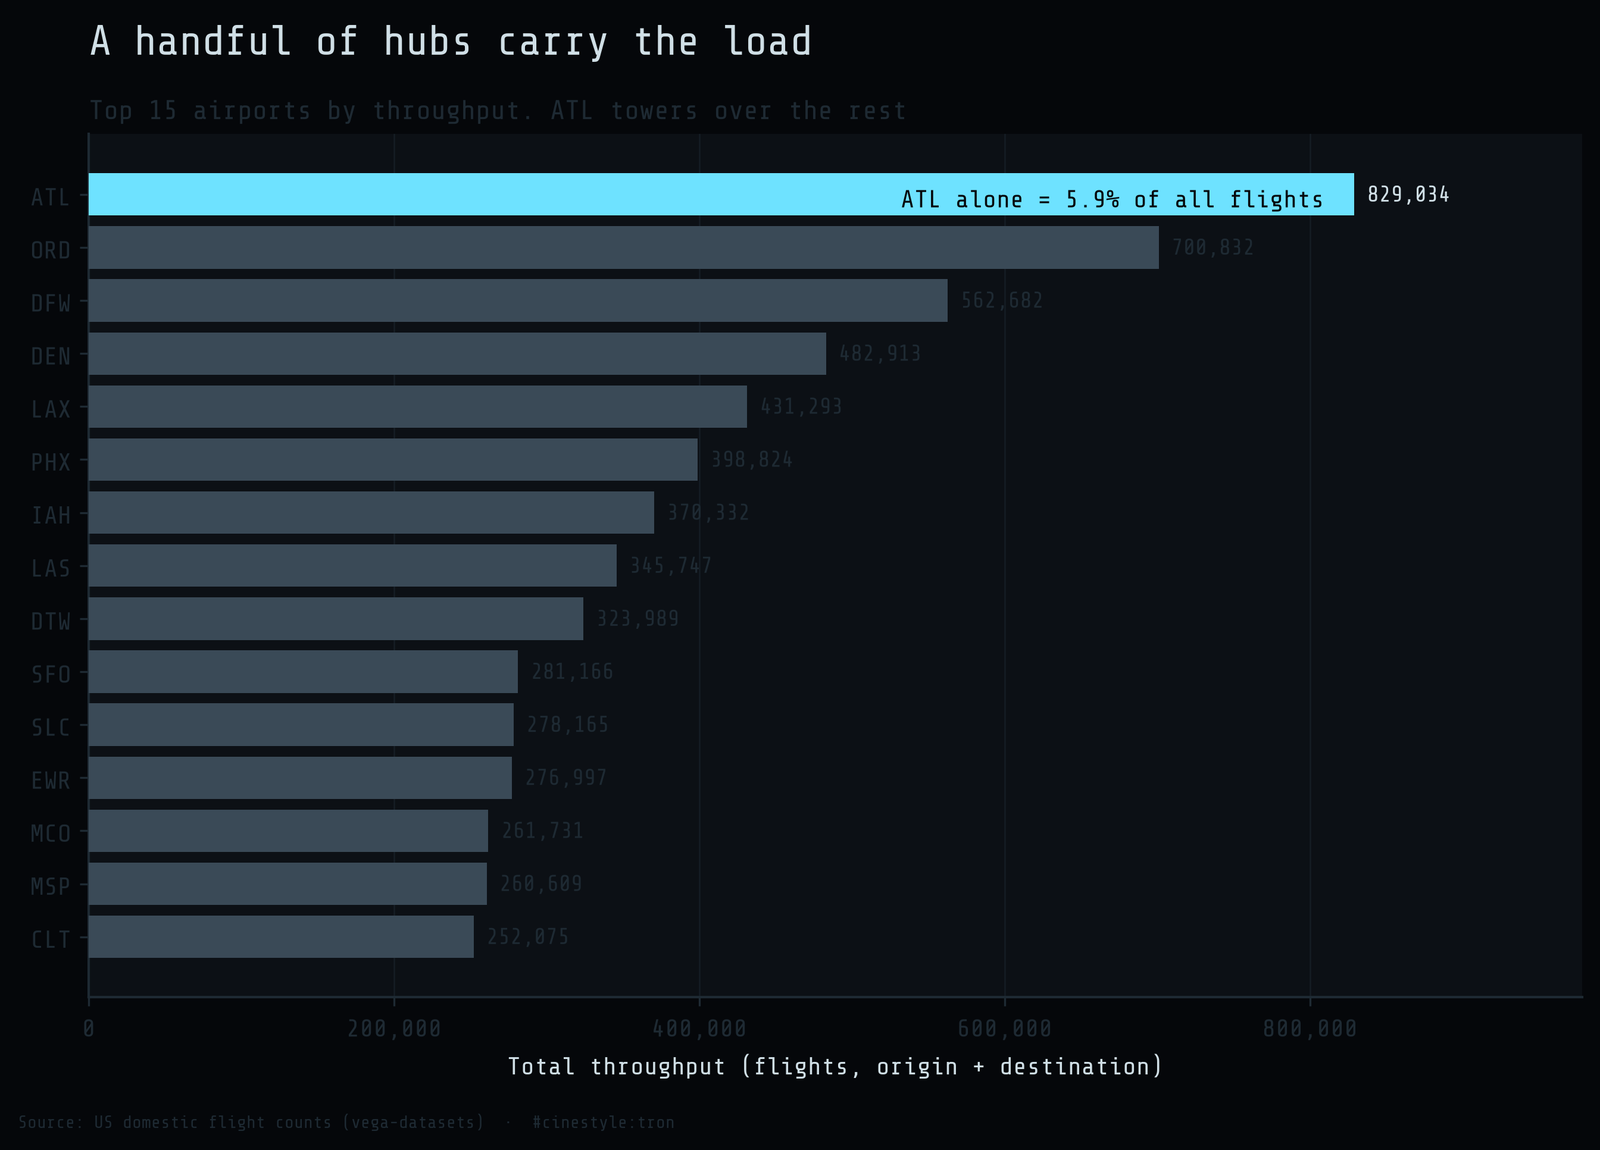
ATL (Atlanta) is the busiest node by both measures. It connects directly to 173 of the other 304 airports. It is the origin of 5.9% of all flights, and it touches 829,034 of the 7,009,728 flights as origin or destination. At that scale ATL is less a hub than the network’s backbone.
Below it the drop is steep but the names stay familiar. ORD, DFW, DEN, LAX round out the top five by throughput. ORD (Chicago) pulls 700,832 flights across 150 connections. Degree falls fast even inside the top ten: ATL connects to 173 airports, while EWR, tenth by degree, connects to 93.
Degree and load also come apart. MSP ties DEN at 127 connections but carries 260,609 flights to DEN’s 482,913. CVG reaches 113 airports with only 182,610 flights. On the switchboard, many plugged-in lines do not mean many calls.
I quantified the inequality two ways. One definition matters for every share in this article: the Gini, the top-ten share, and the 50% and 80% counts all rank airports by flights originating there, so each flight is counted once. The hub rankings above use origin plus destination throughput. The Gini coefficient on airport traffic is 0.769, deep into the range where a handful of points dominate the whole distribution. The degree Gini is 0.651, slightly gentler because even a small airport needs a few routes to exist at all, while a big one cannot connect to more than 304 others. The ceiling compresses the top.
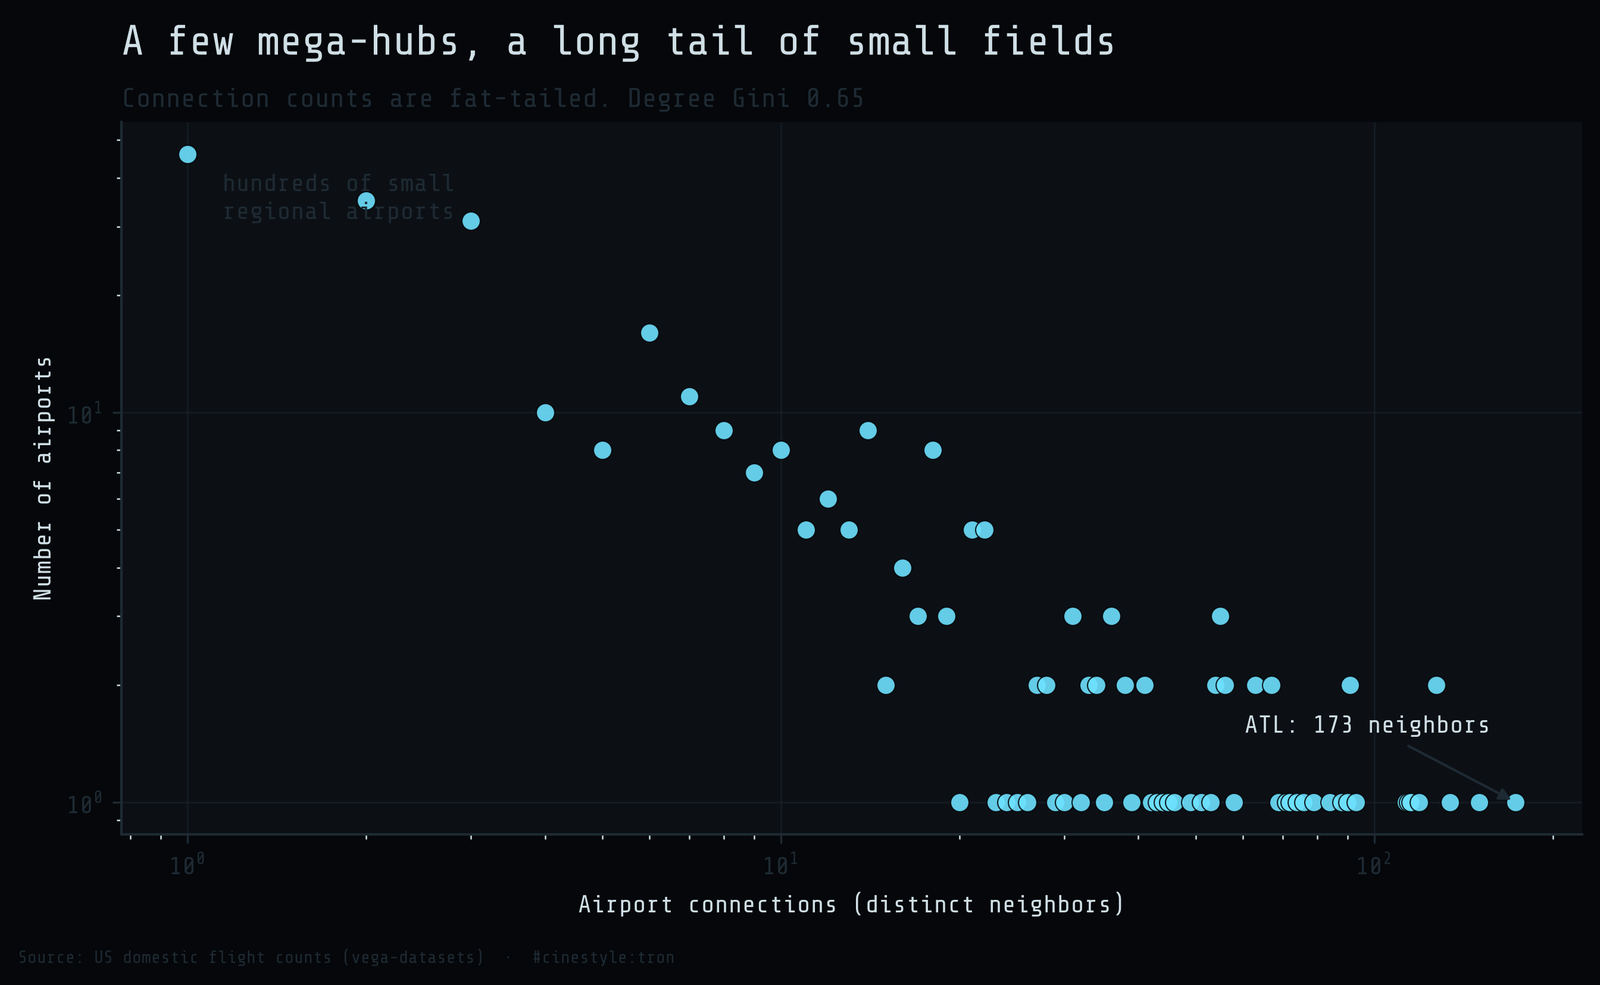
The log-log degree plot shows the tail. A power-law tail would show up as a roughly straight downward line on log-log axes, and the plot leans that way: a dense cloud of low-degree airports on the left, a long thin tail of mega-hubs stretching right. I did not fit a power law, so I will only call the distribution heavy-tailed. The very top is ragged because there are only a few airports up there and the counts get noisy. Most nodes are tiny, a few are enormous, and every later section follows from that asymmetry.
The concentration curve is the part that should worry you
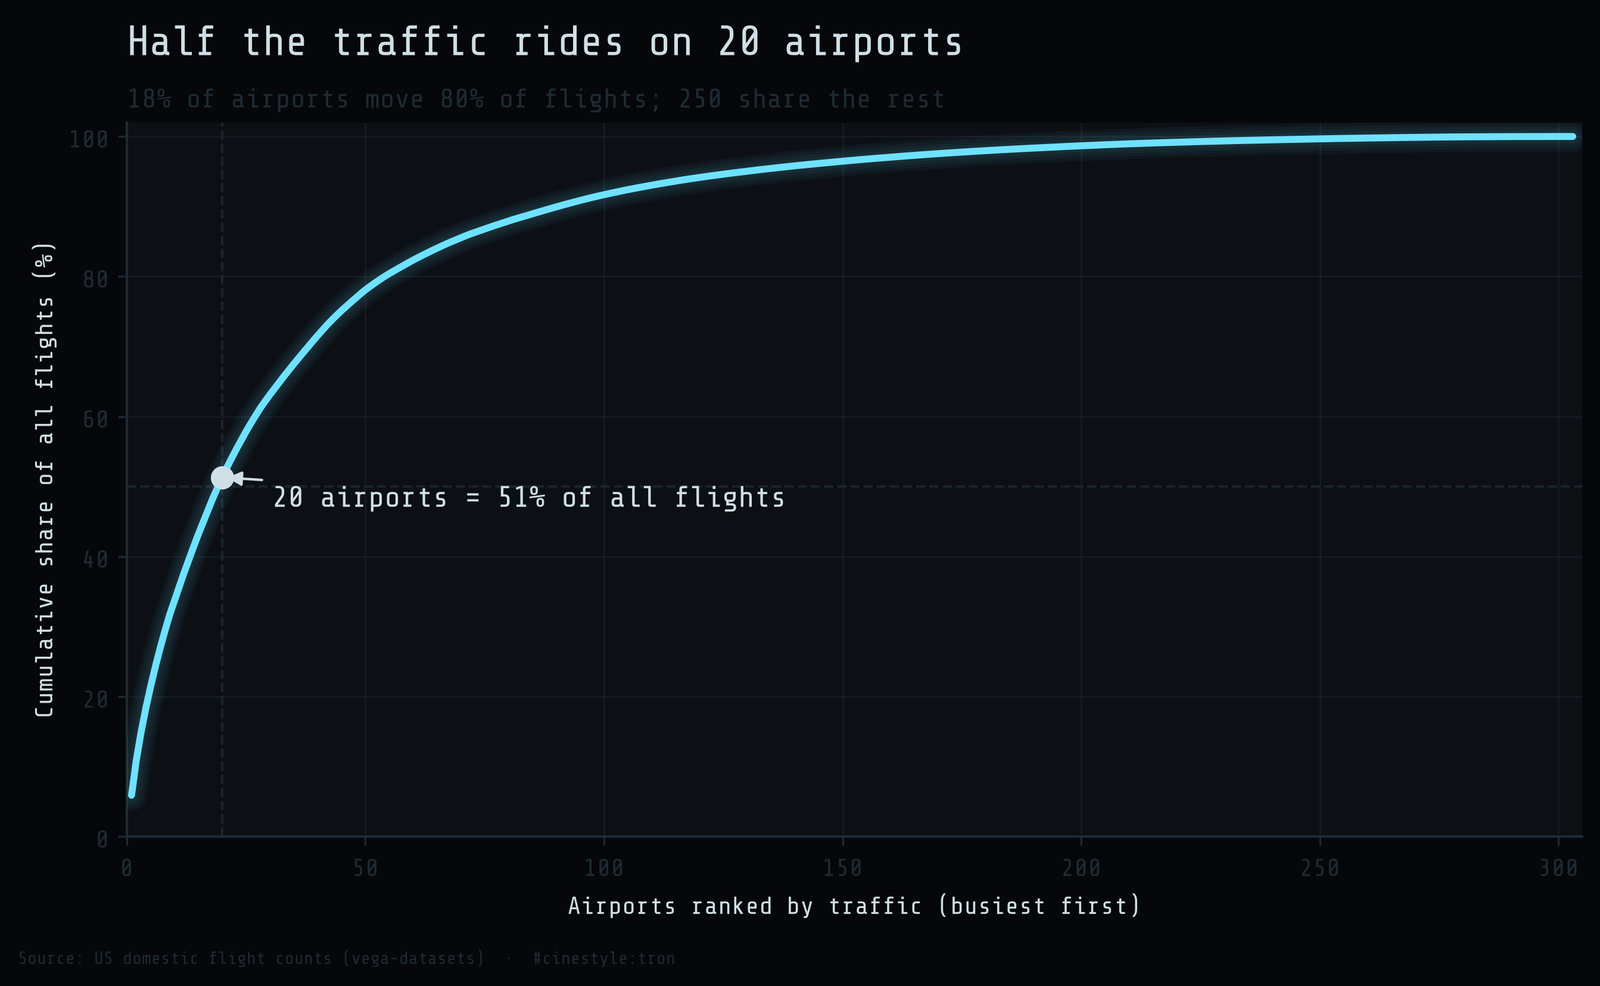
Rank the airports by traffic and walk down the list summing their share. You hit 50% of all flights at 20 airports, 51.3% to be precise. Eighty percent takes 55. So about 18% of the airports move 80% of the traffic, and the remaining 250 split what is left.
If you have ever sharded a database, that curve is your nightmare partition. Twenty hot keys out of 305 holding half your write volume. You cannot round-robin your way out of that. Consistent hashing assumes a roughly uniform keyspace, and the flight network is the counterexample, because here the keyspace is the skew. The real-world fix is the one the airlines already use. You do not fight the hub, you provision for it. Atlanta gets five parallel runways and a dedicated everything, because pretending it is an average airport gets people stranded.
Blast radius
This is where the skew stops being a curiosity and becomes a risk model. I asked a blunt question: if the top hubs go dark, how much traffic is stranded? A flight is stranded if its origin or destination was one of the removed airports.
Knock out the five busiest airports and 40.8% of all flights are stranded. Knock out ten and you have touched 60.0%. Half of all traffic is stranded after only eight removals: ATL, ORD, DFW, DEN, LAX, PHX, IAH, and LAS. By twenty removals the stranded share reaches 82.0%, and the curve is flattening because each further hub adds less.
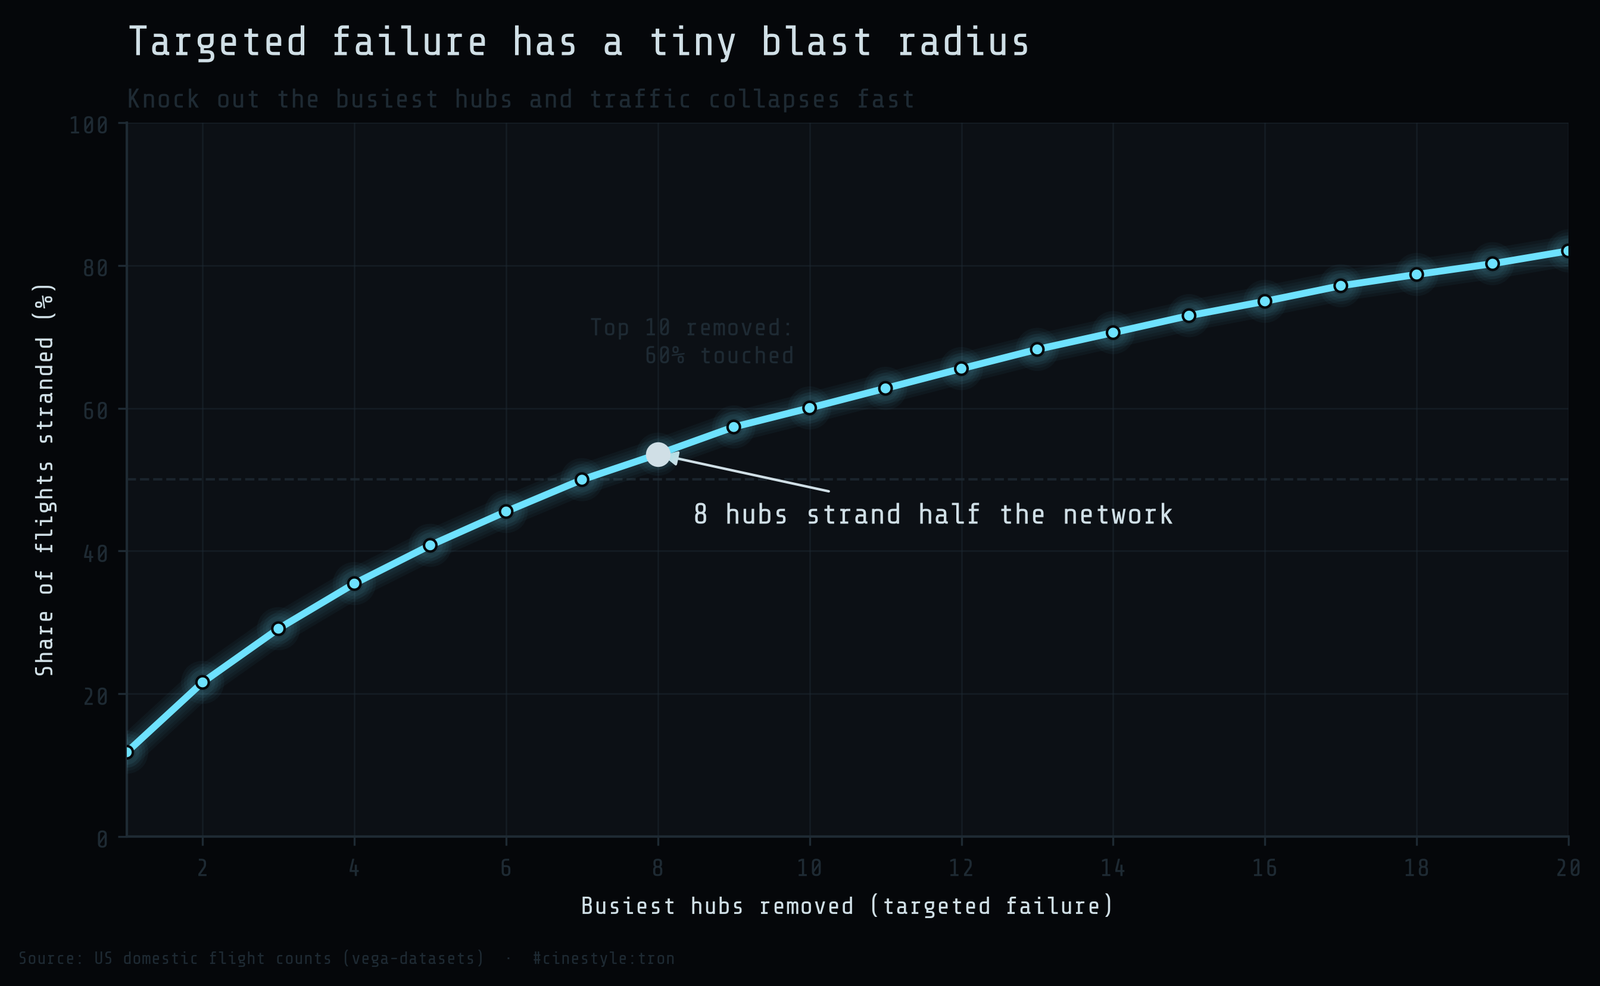
This is targeted-failure math, and it is the dark side of the hub-and-spoke design that makes the network efficient in the first place. I simulated only targeted removal. Network-science work on heavy-tailed graphs finds they tolerate random failure far better, because a random pick is usually a small field, but I did not test that here. Targeted failure is the dangerous case, because the targets are obvious and few. Every architect who has drawn a fan-out diagram with one shared service in the middle has built this exact graph. The shared auth service, the central message broker, the one Postgres primary: they are all ATL. Cheap and elegant until the day they are the blast radius.
The caveat, then the lesson
One honesty check before anyone quotes the 60% figure in a slide deck. This is a single snapshot of US domestic flights from vega-datasets, and the counts are not seasonally resolved. There is no time dimension, so I cannot tell you whether ATL’s dominance holds in a February blizzard or whether the concentration tightens at Thanksgiving. The structure is real, but this data cannot show how it moves over time.
When I size a system now, I do not start from the average node. I start from the assumption that some node will end up being ATL whether I planned it or not, because skew is what real networks do, in traffic, airports, social graphs, and key distributions alike. You will get a hub either way; the useful question is whether you find the eight that matter before they go dark.