// article
College Majors and Pay
Your major sets the odds, not the salary
Pick a college major and you have changed your expected paycheck. Pick petroleum engineering and the median recent graduate earns $110,000; pick counseling psychology and the median is $23,400. That gap is real, and it is large. What the median hides is that within almost every major, two graduates with the same diploma can earn double or half what the headline number says, and once you account for that, the tidy ranking everyone argues about starts to dissolve.
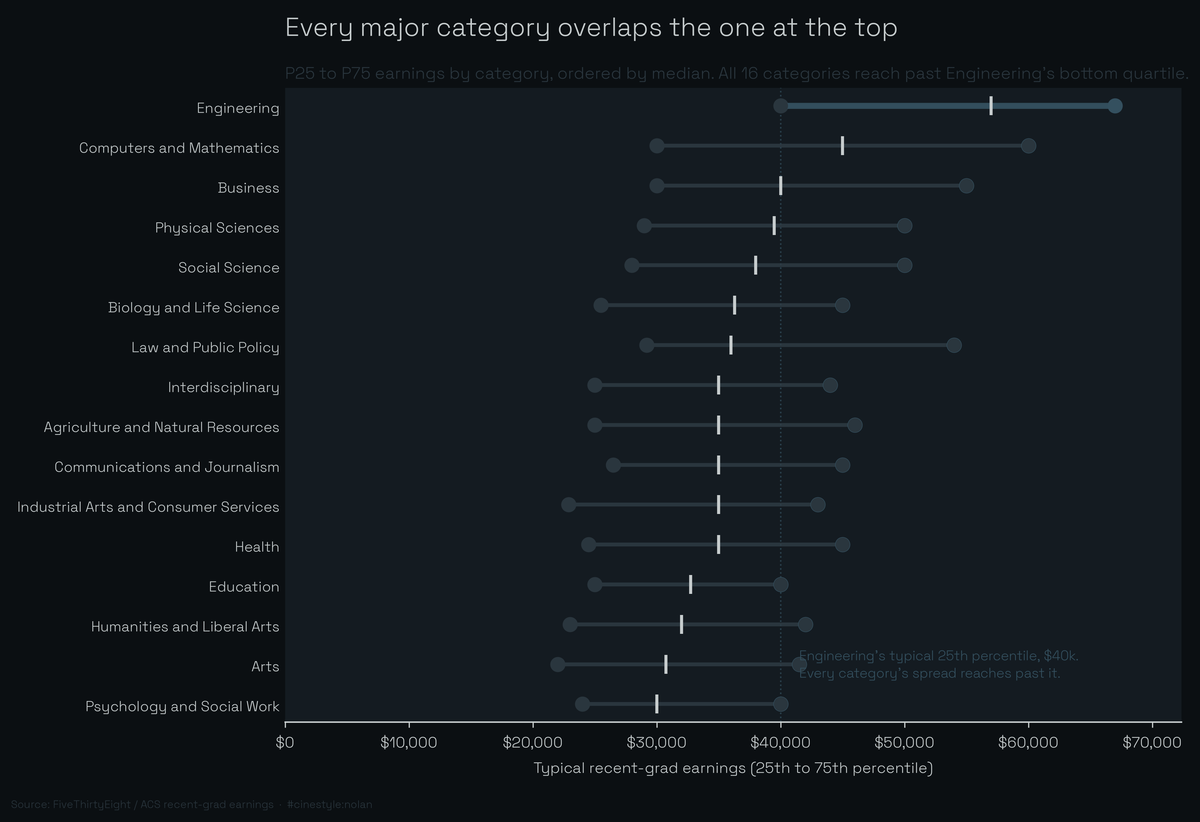
Each bar above is one major category, drawn from its typical 25th percentile to its typical 75th. Engineering sits at the top, the way every “what should I study” thread on the internet promises. Look at where the other bars end, though. All 15 other categories stretch past Engineering’s own bottom quartile. The ranking is real at the median, and the overlap is real everywhere else, and the overlap is the part nobody puts on a poster.
The data is FiveThirtyEight’s recent-grads table, built from the Census Bureau’s American Community Survey: 173 majors, 16 categories, each with a median and a 25th and 75th percentile of earnings. The percentiles come pre-computed, which is the reason this dataset is worth loading. Most salary charts only ever show you the median, and the median is the one number that hides the thing I wanted to look at.
The spread inside a major rivals the gap between categories
One comparison reframes the debate. The typical major has $20,000 between its 25th and 75th percentile earners. The gap between the lowest-paid category median and the highest is $27,000, nearly the same size. Individual majors range much further, $88,000 from the lowest median to the highest, so the claim holds for categories, not for the extreme majors.
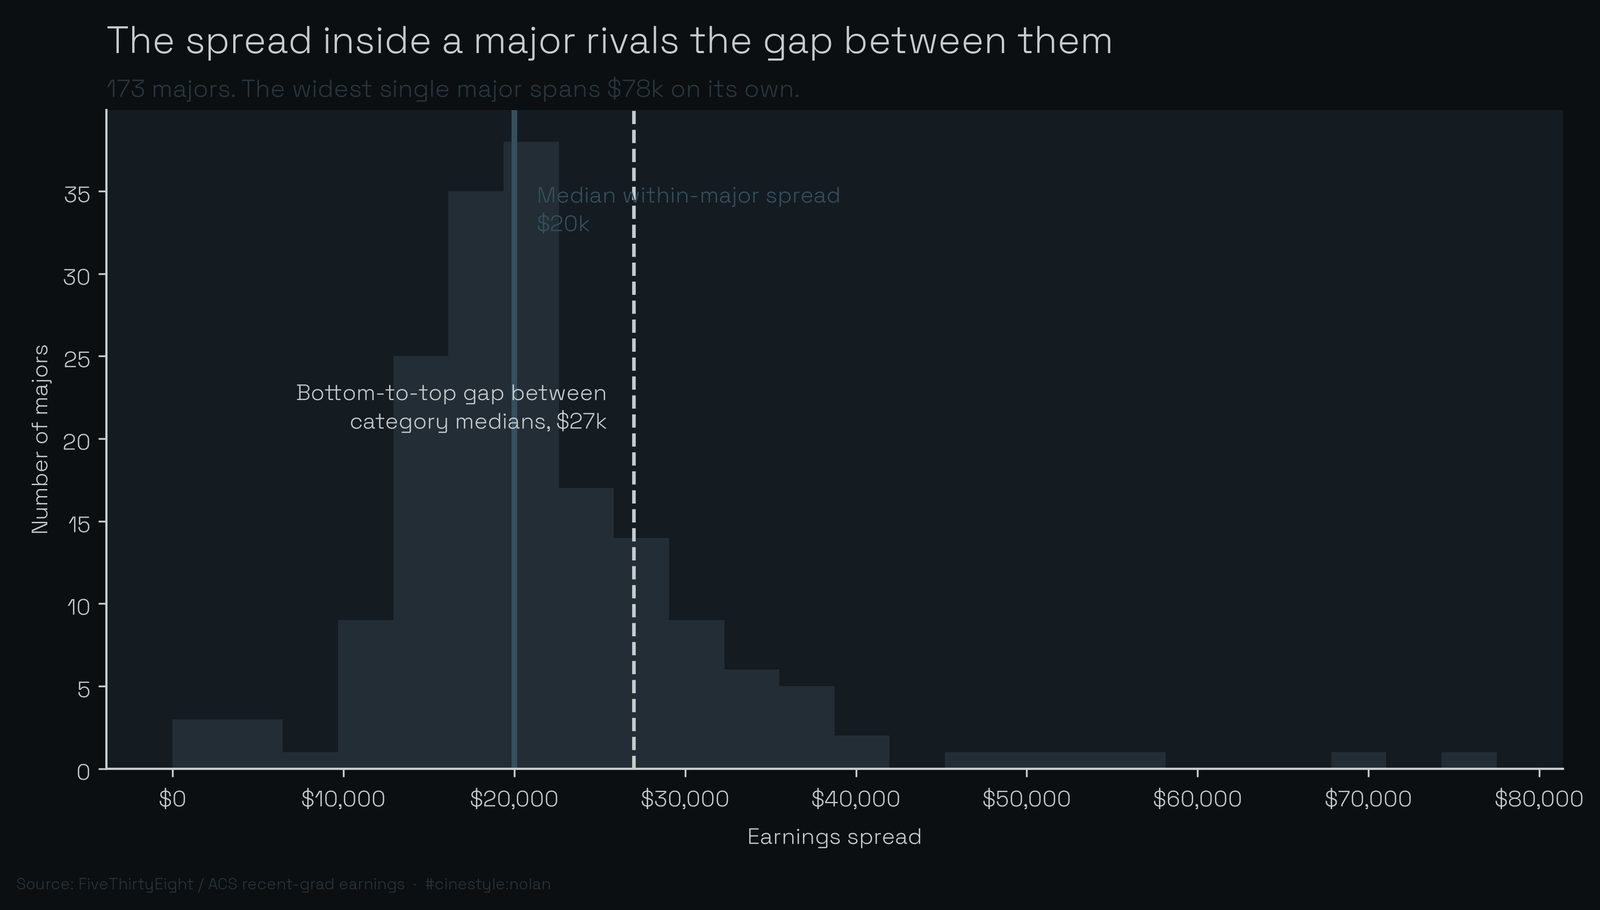
Think of it as two rulers laid end to end. One measures how far apart majors are from each other. The other measures how far apart graduates are inside a single major. They are roughly the same length. Engineering, the category that wins the ranking, has $27,000 between its own typical quartiles, which is exactly the distance from the bottom category to the top. The variation that lives inside the winning major is as wide as the entire contest between categories.
This is why the “STEM pays” story is half true. The median STEM major pays $45,000 against $34,000 outside STEM. Yet 52 of the 109 non-STEM majors, 48%, have a 75th percentile at or above that STEM median. The story is true on average, and it says little about any one graduate inside the overlap. When the within-group spread is as wide as the between-group gap, knowing someone’s major tells you which distribution they drew from, not which number they landed on.
Same diploma, double the pay
The spread is not evenly distributed. Some majors are tight clusters and some are lottery tickets.
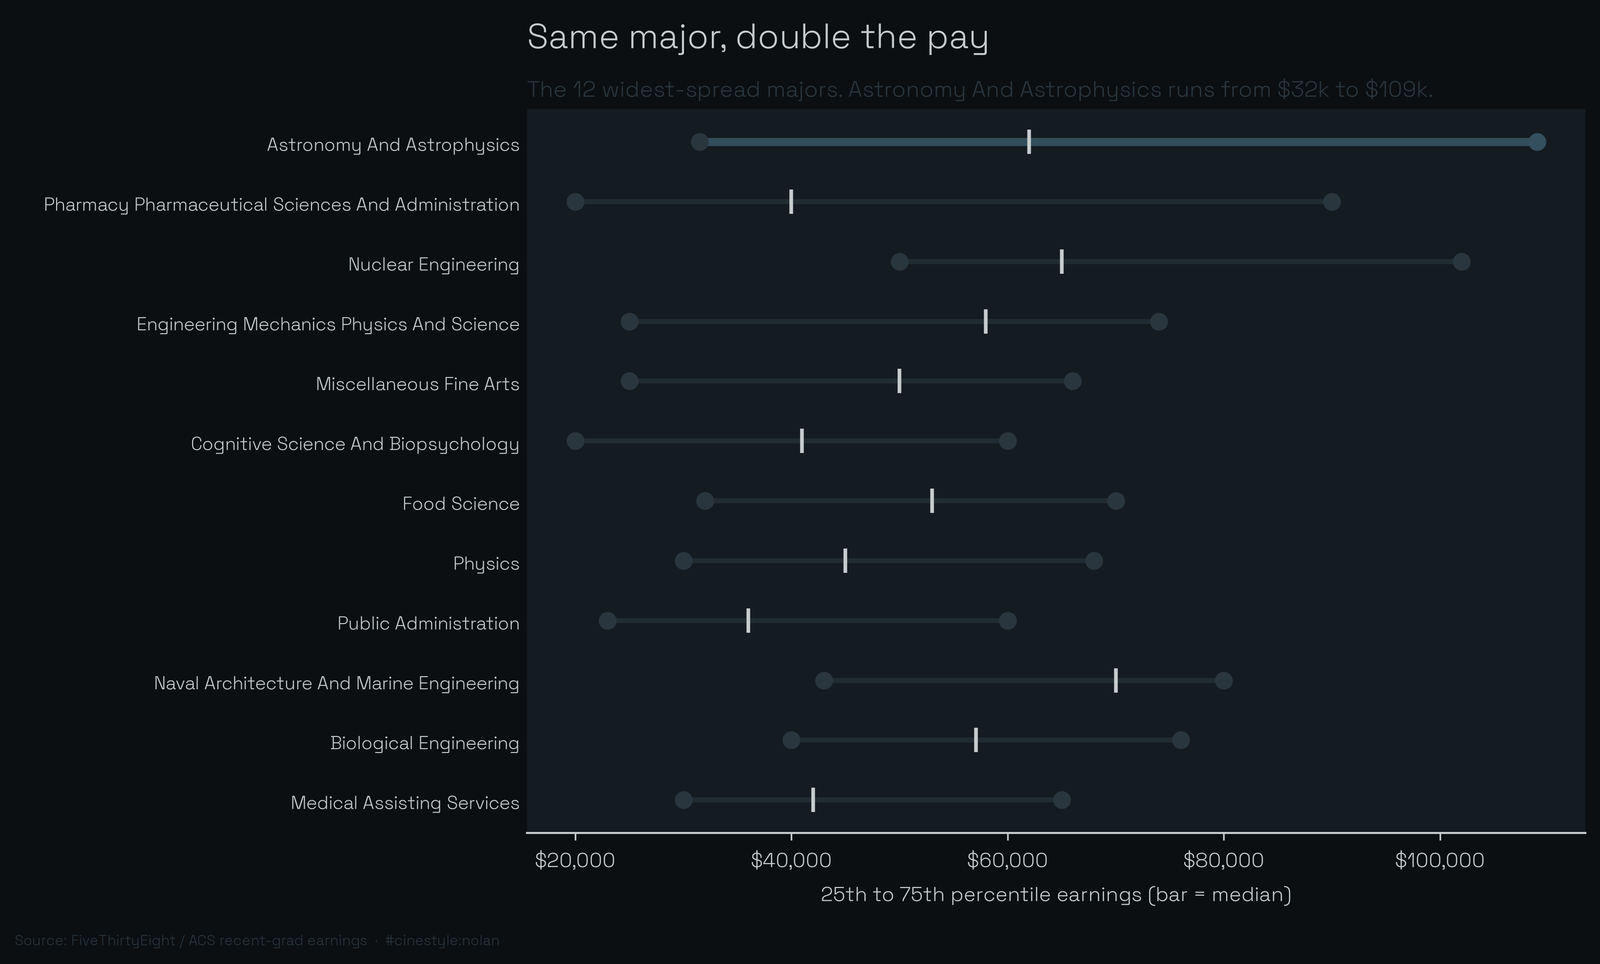
Astronomy and astrophysics is the widest in the set. Its 25th percentile graduate earns $31,500 and its 75th percentile graduate earns $109,000, a span of $77,500 inside one major. The median sits at $62,000, a number that describes almost nobody at the tails. Nuclear engineering, pharmacy, and food science follow the same pattern: a median that looks like a destiny and a spread that says otherwise.
A wide spread is not automatically good or bad. It means the major is a gateway to very different careers, and the choice of which career happens after graduation, not at registration. A narrow major predicts pay well, and a wide one mostly predicts the range.
What actually tracks with pay
I checked two common explanations, unemployment rate and share of women, and only the second tracks pay.
Unemployment barely moves with pay. The correlation between a major’s unemployment rate and its median earnings is -0.11, which is close enough to zero that I am setting it aside. Low-paid majors are not meaningfully harder to get hired into; they just pay less once you are in.
The share of women in a major is a different story.
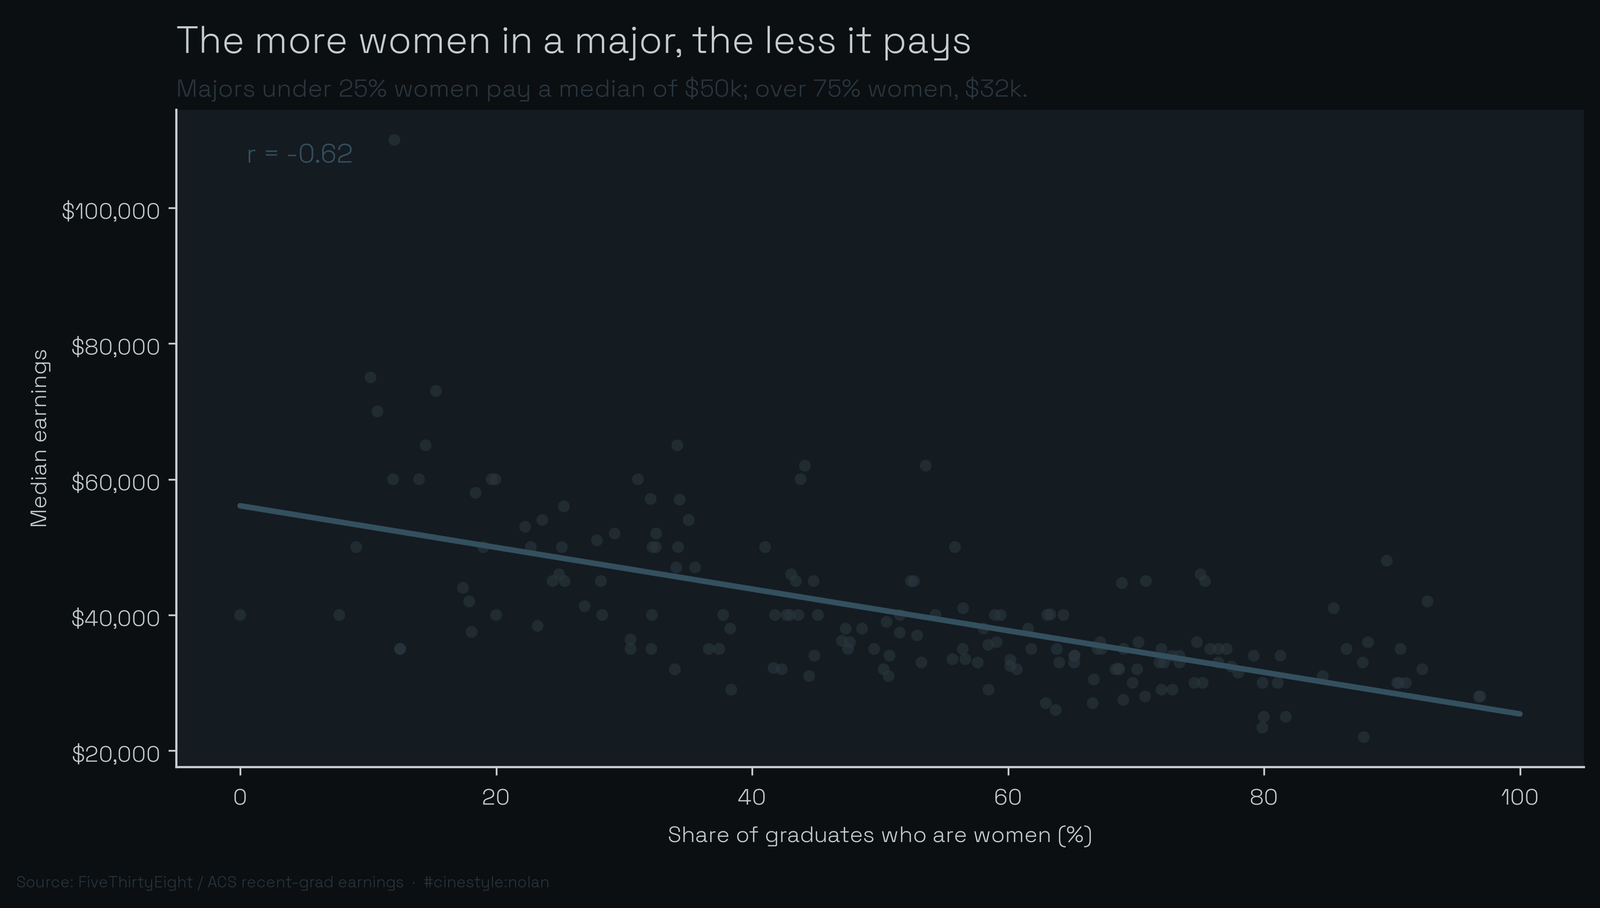
The correlation is -0.62, far stronger than the unemployment correlation of -0.11. The 26 majors that are under 25% women carry a median of $50,000. The 31 majors that are over 75% women carry a median of $32,400. That is a $17,600 gap that runs straight along the gender composition of the field, before any individual has negotiated a single salary. This dataset cannot tell you the cause. It can tell you the pattern is steep and consistent.
What a starting-salary table cannot see
These are recent graduates only, so the figures capture the starting line, not the career. Majors that pay flat early and climb late, or the reverse, will look different a decade on, and this table cannot see that. The percentiles are also national, which washes out the cost-of-living differences between where a petroleum engineer and a social worker actually take their first jobs. A few majors carry thin samples, which is why I held the named examples to fields with at least ten survey respondents. That filter is also why the lowest median I name is $23,400, not the $22,000 floor of the full table, which belongs to a major below the cutoff.
None of that touches the main finding. The median is a single point standing in for a distribution, and for college majors that distribution is wide enough that the point lies by omission. The ranking everyone fights about is real. The spread it papers over is just as large, and it is the part that decides which side of the median you end up on.