// article
Market Seasonality
Sell in May, and other things the calendar does not actually tell you
“Sell in May and go away” is one of the oldest pieces of market advice that still gets repeated with a straight face. The claim is specific: stocks earn most of their return from November through April, and the May to October half is dead money you are better off sitting out. I pulled 155 years of S&P 500 monthly returns to test it. The summer half is weaker but still positive, and the gap is too small to tell apart from luck.
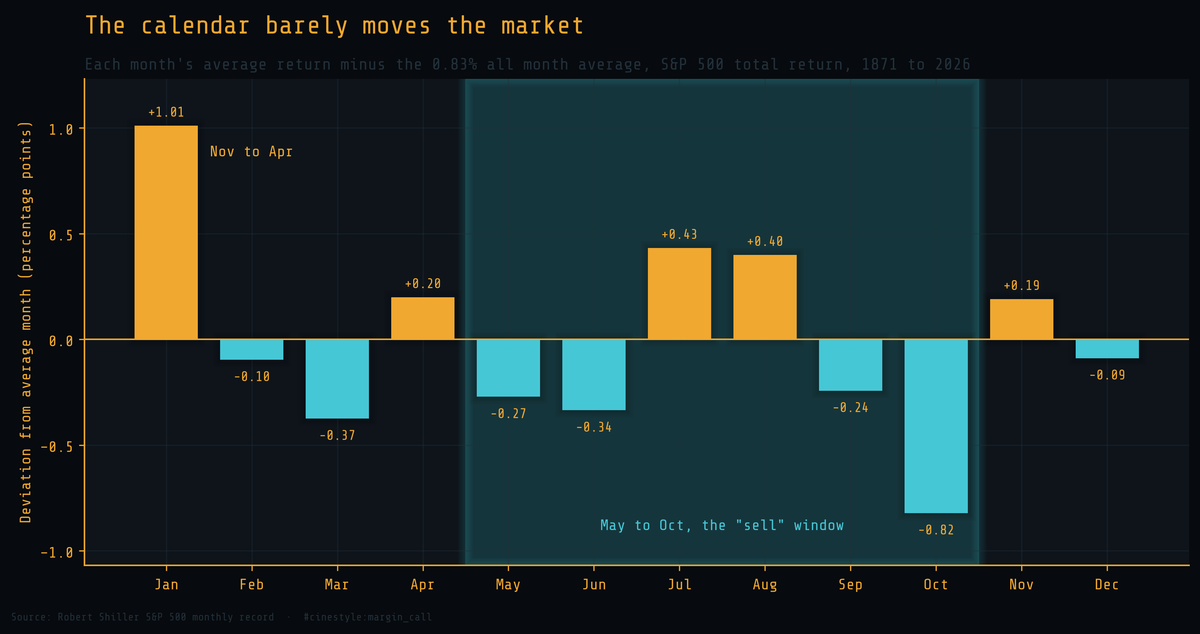
Each bar above is one calendar month’s average return, measured as its distance from the overall monthly average of 0.83%. The “sell” window is shaded. If the myth were clean, every shaded bar would point down and every unshaded one up. They do not. July and August are among the strongest months in the year, and the single worst month, October, is the one that drags the summer half down.
The data is Robert Shiller’s monthly S&P 500 record: 1,864 monthly returns from February 1871 to May 2026. I build total return as price change plus the month’s dividend, using Shiller’s annualized dividend divided by twelve. The most recent 35 months carry no reported dividend yet, so those fall back to price return alone, which understates each of those months by about one twelfth of the annual dividend yield. Nothing here is cleaned beyond that.
The gap is real, and it is also noise
Average return from November through April is 0.97% a month. From May through October it is 0.69%. So the seasonal story has a kernel of truth: the winter half does beat the summer half, by 0.28 percentage points a month.
Then you ask whether 0.28 points is a signal or a coin landing heads a few extra times. A Welch t-test on the two groups gives a p-value of 0.14. I bootstrapped the gap ten thousand times to see the shape of the uncertainty, and the 95% interval runs from minus 0.09 to plus 0.65 points. It straddles zero.
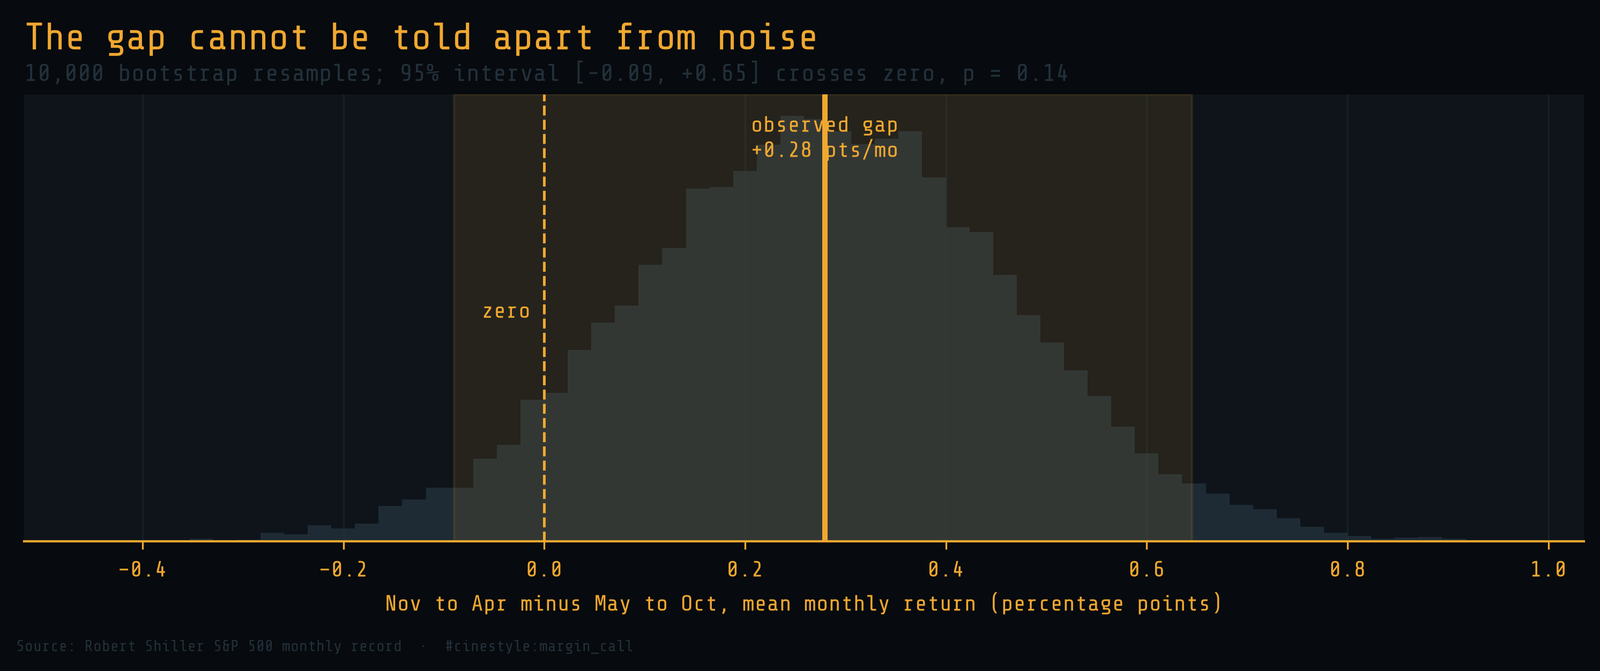
A 95% interval that contains zero means I cannot rule out the possibility that there is no seasonal effect at all. The point estimate leans the way the myth predicts, but the evidence is too thin to trade on.
It worked once, in one era
Splitting the record by era is where the story turns. The gap is not constant; it is almost entirely a mid-century phenomenon.
- 1871 to 1949: gap of negative 0.11 points. p = 0.71. Summer was fractionally better.
- 1950 to 1987: gap of plus 0.79 points. p = 0.01. This is the real one.
- 1988 to 2026: gap of plus 0.57 points. p = 0.08. Suggestive, not significant.
- 2000 to 2026: gap of plus 0.39 points. p = 0.35. No longer significant.
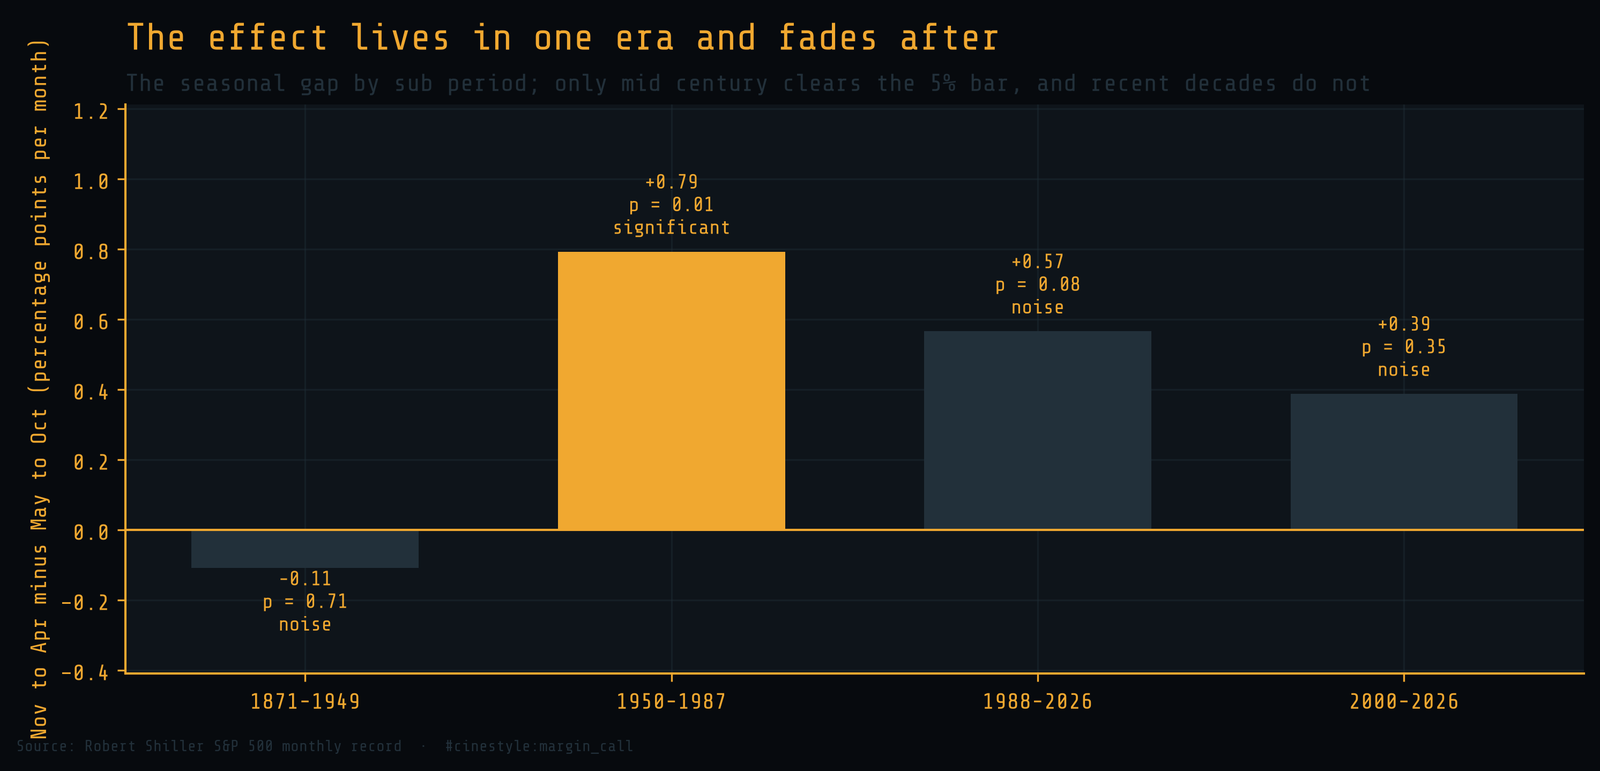
Only the 1950 to 1987 window clears the 5% significance bar. The effect did not exist in the nineteenth and early twentieth centuries, peaked through the postwar decades, and has faded since, which is the textbook signature of an anomaly that gets arbitraged away once enough people know about it. The “Sell in May” effect was at its strongest in exactly the decades before anyone could cheaply act on it.
What is actually in the summer is October
Strip October out and the rest of the summer barely differs from winter. The May through September gap shrinks to 0.14 points a month, half of what it was. The weak summer is mostly one terrible month wearing a six-month costume.
October holds three famous crashes: down 10.3% in 1929, 11.9% in 1987, and 20.2% in 2008. They are not the three worst months in the record, and one bad month a year does not make a six-month season. A seasonal rule built to dodge October is not a calendar strategy. It is a bet that the next crash keeps to the schedule of the last three.
The cost of believing it
Suppose you ignored all of the above and sold every May, parking in cash until November. Here is what that discipline would have done to a dollar invested in 1871. The cash leg earns nothing in this test, no interest at all, which overstates the cost of selling.
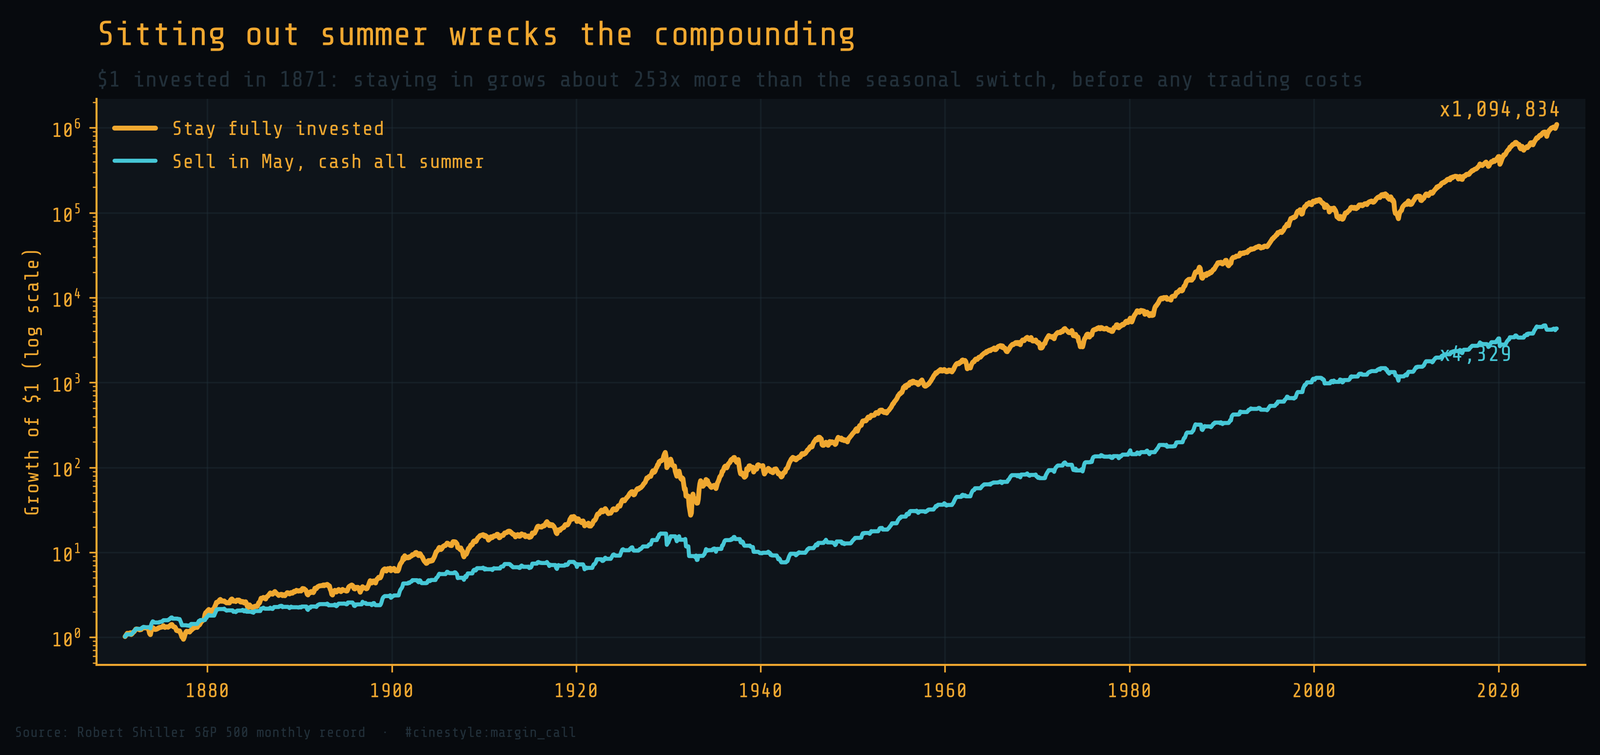
Staying fully invested turns the dollar into roughly 1.1 million dollars. Selling every May turns it into about 4,300. Staying in wins by a factor of 253, and that is before a single dollar of transaction cost or tax on the round trips the strategy demands twice a year. The reason is the part the myth gets exactly backward: May through October still earns 0.69% a month, which compounds to about 4.2% over the half year. The summer is slower money, not dead money, and a century of compounding makes that difference decisive.
I went looking for a tradable season and found a folk memory of October. The winter half does win, by an amount I cannot distinguish from luck, in a window that closed decades ago, against a strategy that ended with one 253rd of the buy-and-hold result. Sell in May and go away, and the market goes up without you.