// article
Box-Office Economics
Spend more, make more, but a third of films still lose money before the lights come up
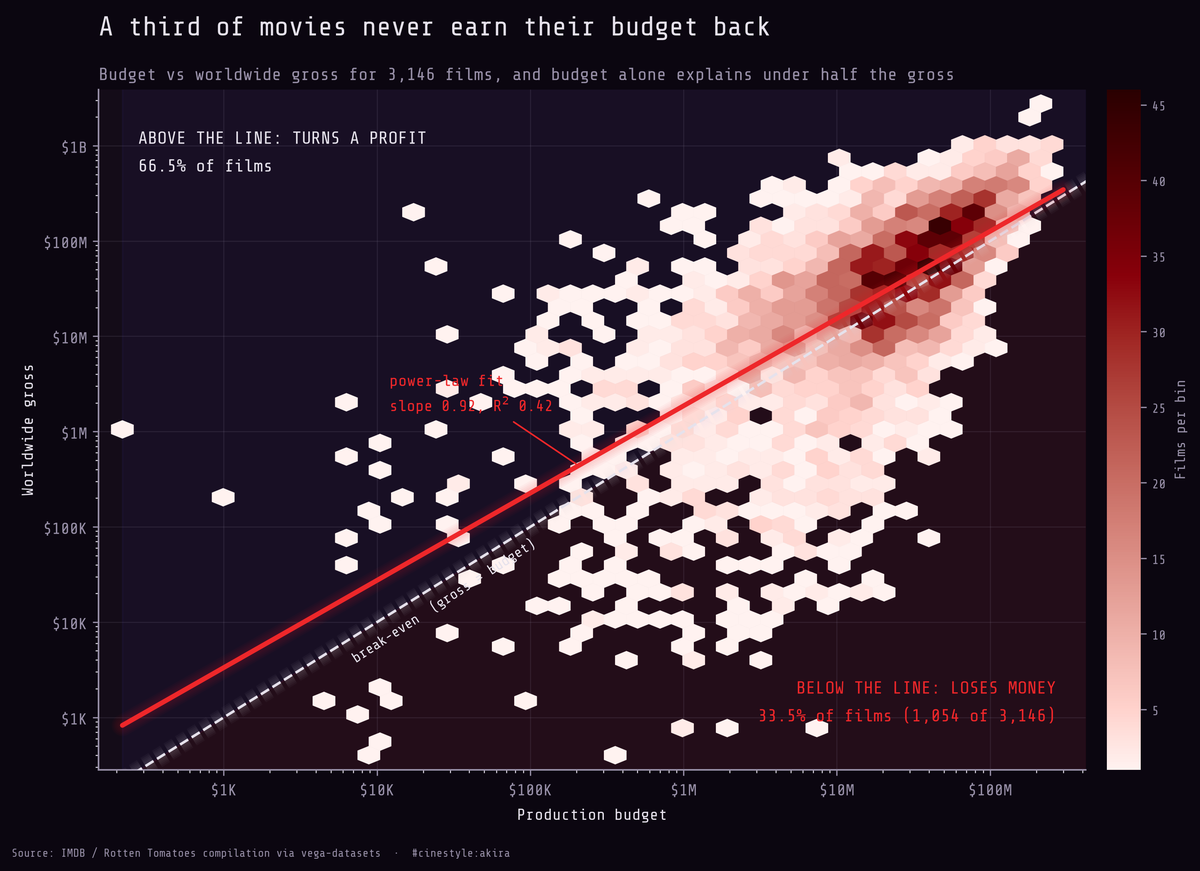
Bigger budgets buy a higher floor, not a guaranteed profit. The cloud of films climbs with budget, but the break-even diagonal cuts straight through it. Everything below that dashed line lost money on production cost alone, and a third of the dataset sits there.
One in three movies in this dataset never earned back its production budget. 1,054 of 3,146 films grossed less worldwide than they cost to shoot, a 33.5% loss rate. That is the generous count, because production budget is the only cost I am subtracting. Marketing, prints, distribution, the studio’s cut to theaters, none of it is in here. The real share of films that lost money is higher than a third. I just cannot see how much higher from this data.
I pulled the movies table from vega-datasets, an IMDB and Rotten Tomatoes compilation, and went in with a dumb question. Does spending more get you more? The short answer is yes, weakly, and with enormous variance. The long answer is worth the rest of the page.
The data, and what is wrong with it
3,201 rows, 16 columns. After dropping films with a missing or zero worldwide gross (47 had a literal zero gross, 7 were null, one budget was null), I kept 3,146 rows with both a positive production budget and a positive worldwide gross, 98.3% of the file. That high survival rate is itself a warning. This is a compilation of released, theatrical films with reported budgets. The straight-to-video flops, the projects that died in development, the indie features nobody tracked: none of them are here. Whatever I find about ROI is conditioned on a movie being finished, released, and notable enough to log.
The dollar figures are also nominal. A 1990 budget and a 2010 budget sit in the same column with no inflation adjustment, so any trend over time is contaminated. I did not lean on time at all. The clean question is the cross-sectional one, and that is the only one this data can answer honestly.
Budget does predict gross, about as well as you would fear
Plain Pearson correlation between budget and worldwide gross is 0.667. Spearman is 0.678, so a couple of outliers are not dragging it around. Budget and gross really do move together.
But both numbers are spread over five orders of magnitude, so the honest view is log-log. Regress log10(gross) on log10(budget) and you get a slope of 0.916 with an R-squared of 0.424. The slope near 1 means revenue scales roughly proportionally with spend: double the budget, expect to roughly double the gross, on average. The R-squared of 0.424 means budget explains under half the variance in gross. The majority that is left over is what money cannot buy: timing, word of mouth, whether the thing is any good.
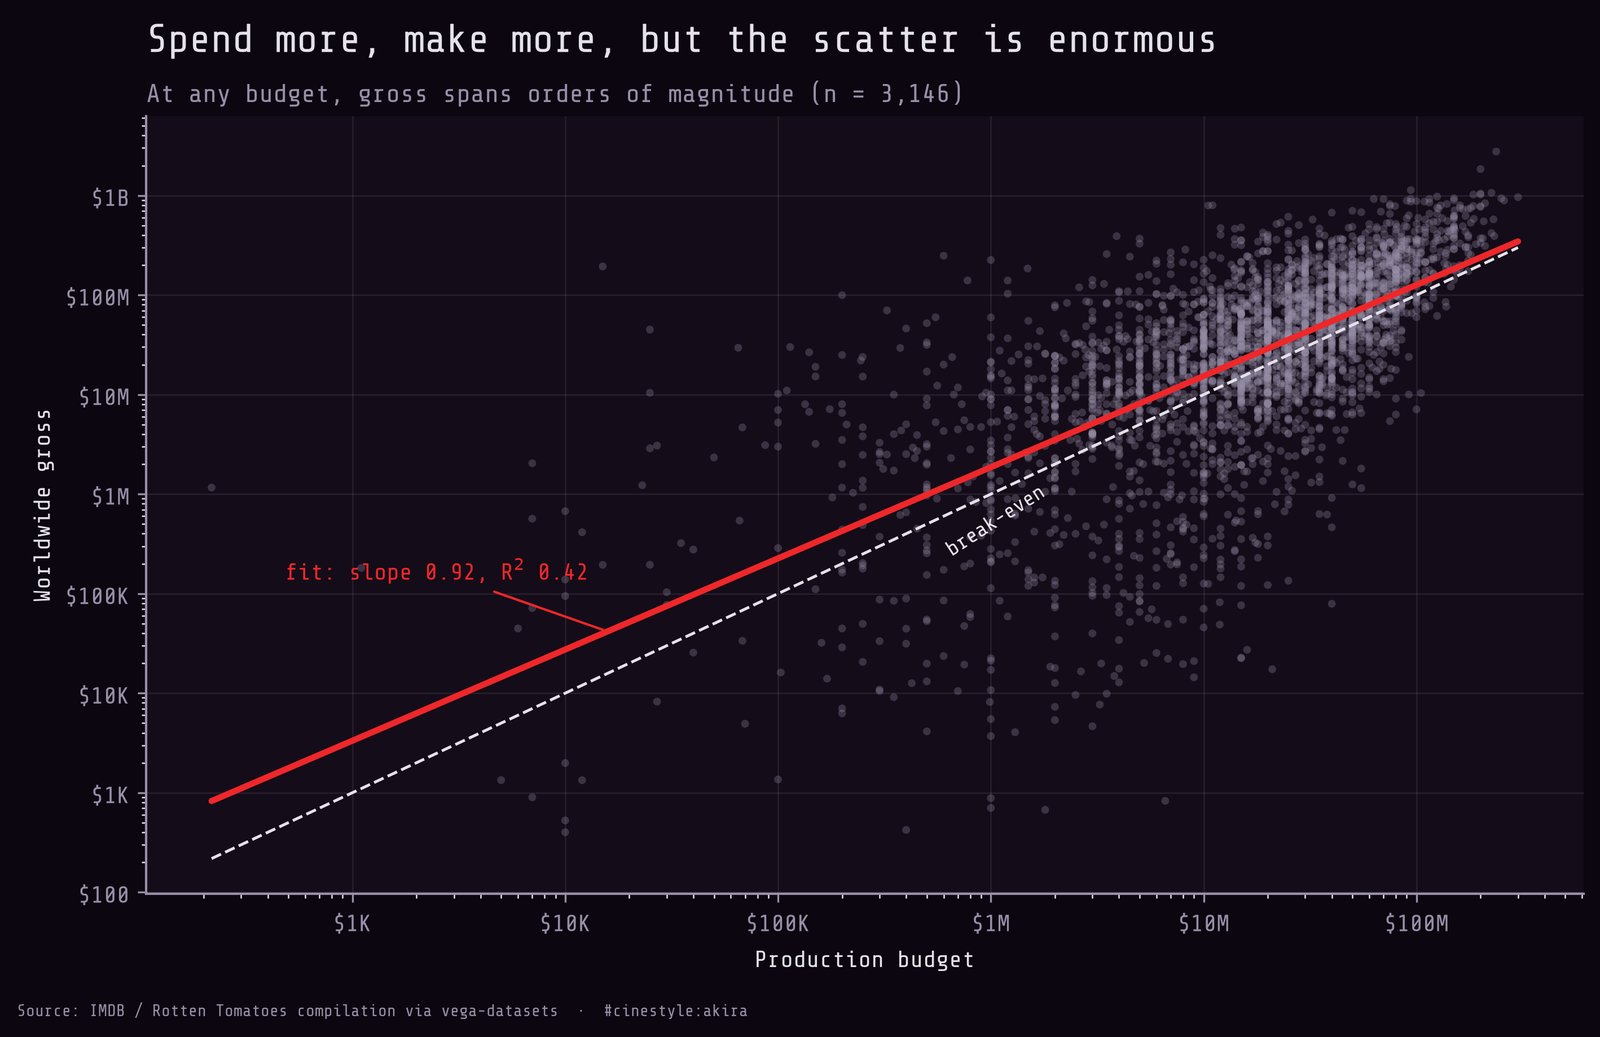
Picture a shelf height, not a price tag. Budget sets how high the film starts, not where it lands. The middle half of films runs from losing 28.5% of the budget to returning three times it in profit (ROI 25th percentile -0.285, 75th 3.013), and budget explains under half of where any one film lands. The red fit line cuts up through that scatter, and the gray dashed break-even line sits below it for most of the range, so the typical film does clear its production cost. The vertical spread at any single budget matters more than the slope.
ROI is where it gets ugly
I defined ROI as (worldwide gross minus budget) divided by budget. Median ROI is 0.856, so the middle film returned about 86% on its production spend. That is positive, which surprised me a little given the loss rate. But the mean ROI is 10.73. A mean twelve times the median marks a heavily right-skewed distribution.
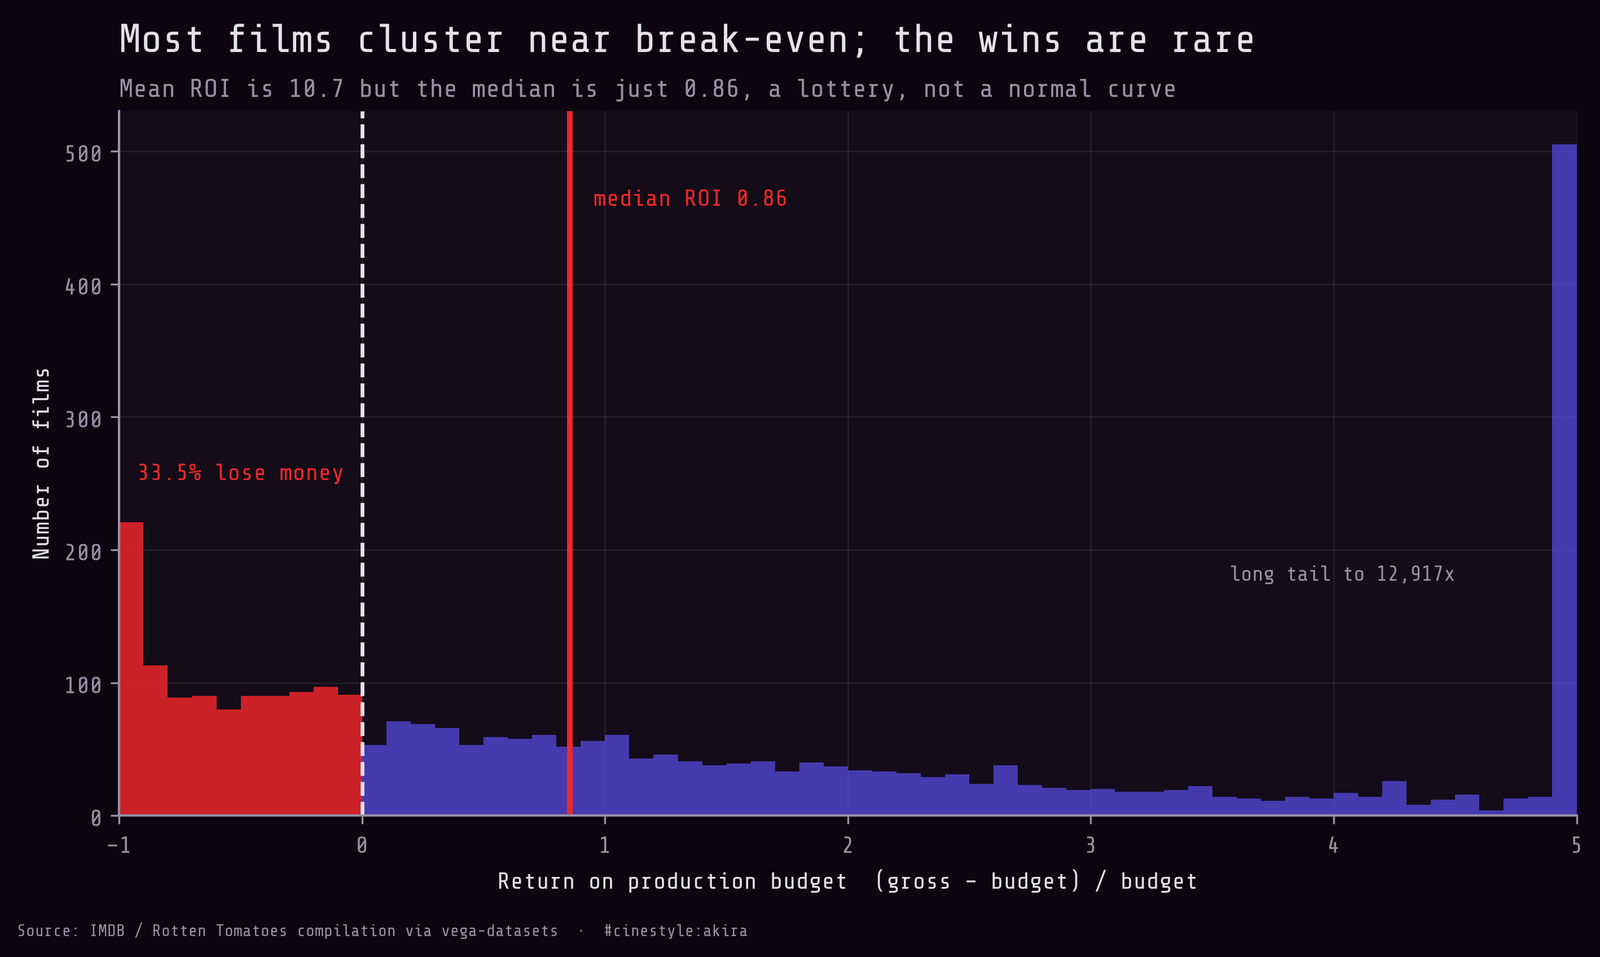
I clipped the histogram at total loss on the left and a 5x return on the right just to make it readable, because the max ROI in the full data is 12,917, some micro-budget film that caught lightning. The bulk of the mass sits just above break-even, with a long thin tail stretching off the right edge of the chart. The 90th-percentile film has an ROI of 7.68, the median 0.86. The gap between those two numbers is the entire economics of the business.
Most of the profit lives in a handful of films
The concentration number surprised me most. The top 100 films by raw profit, out of 3,146, account for 33.9% of all the profit in the dataset. The top decile, 315 films, takes 64.2% of total profit. The thousand-plus that lost money are pulling in the other direction the whole time.
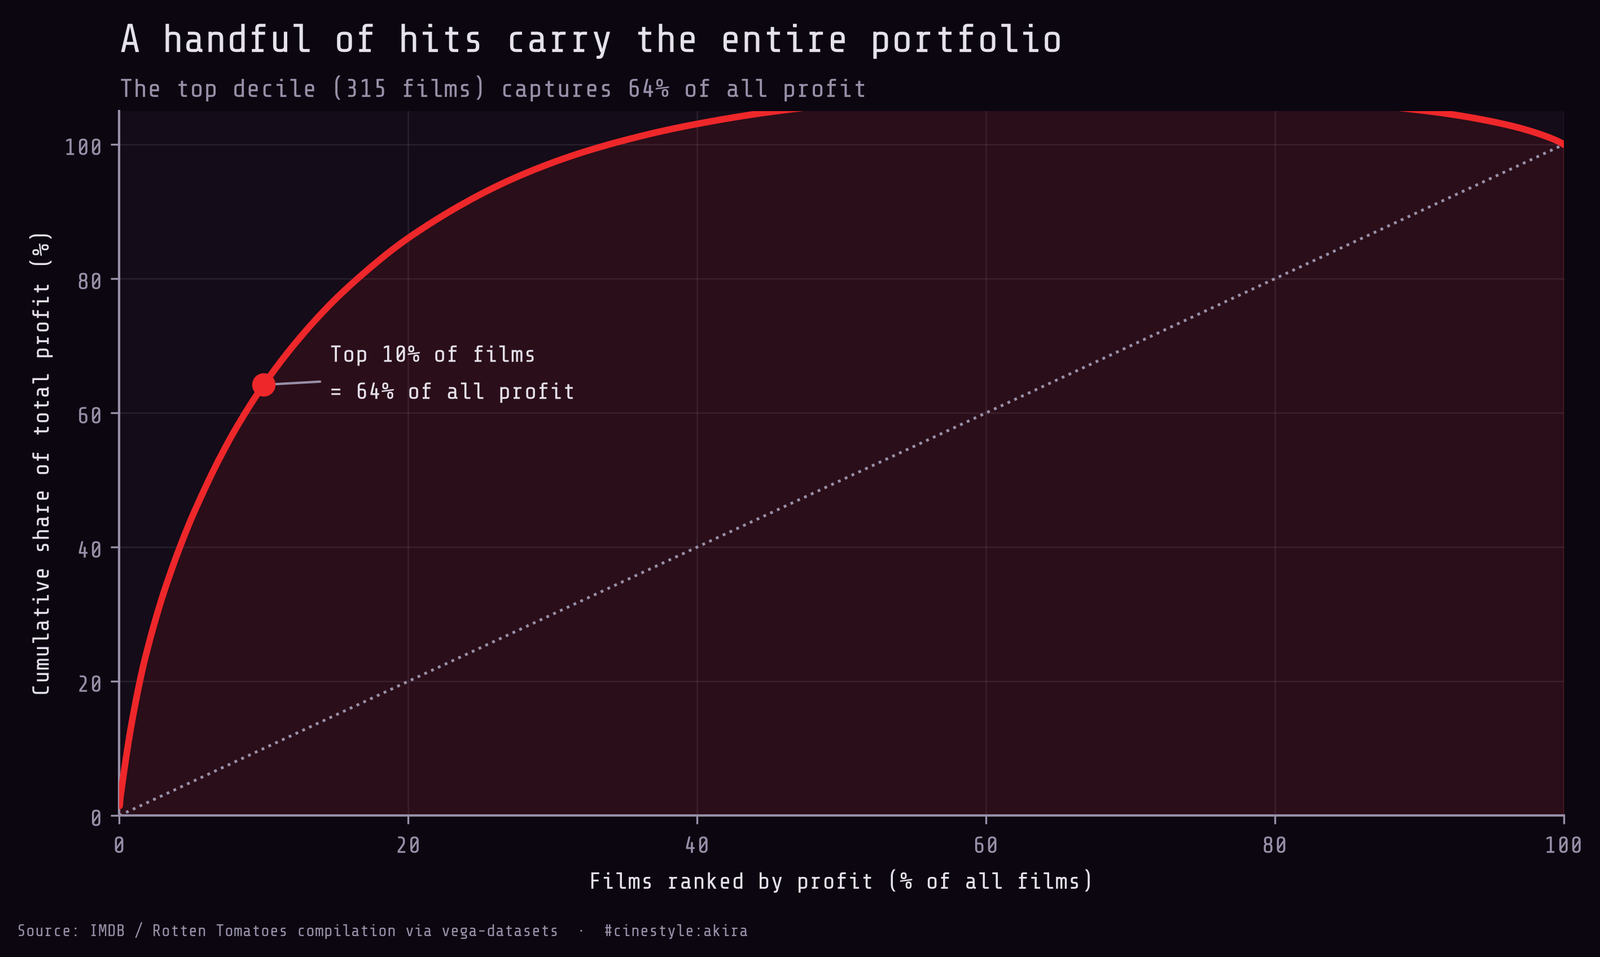
The cumulative curve shoots up fast and then crawls. Even restricting to the 2,091 films that were profitable, the top decile of those still captures 48.4% of the positive profit. This is why studios chase franchises: the median outcome is a modest win, but the portfolio only works if you occasionally land in that right tail, and the right tail is where nearly all the money is.
Does being good help? A little
I expected critic and audience scores to be near-useless for predicting money, and they mostly are. IMDB rating correlates with log worldwide gross at just 0.141, Rotten Tomatoes at 0.112. Ratings explain almost none of the variation in gross.
ROI tells a slightly warmer story. Spearman correlation between IMDB rating and ROI is 0.293, and Rotten Tomatoes against ROI is 0.384. Still weak, but the RT number is the strongest rating signal I found. Good reviews do not reliably make a film gross more, but they do help it earn back relative to what it cost, which makes sense, because a well-reviewed cheap film is exactly the profile that produces those tail ROIs.
Genre splits are real but modest once you require at least 20 films per bucket. Documentary leads on median ROI at 1.70 and Western trails at 0.03, barely break-even. Horror (1.69), musicals (1.67), and adventure (1.53) cluster high; for horror at least that tracks with the cheap-to-make-and-occasionally-explodes pattern. I would not bet a slate on these medians given the survivorship problem, but the ordering is plausible.
So: spend more, make more, sort of. The correlation is real and the slope is near one. But budget explains under half of gross, a third of films lose money on production cost alone, and two-thirds of all the profit is sitting in a tenth of the titles. If you are picking one film, the budget barely tells you who wins. If you are running a hundred of them, you are not buying revenue. You are buying exposure to the right tail, and the tail pays for the slate.