// article
The Olympic Body
The body an Olympic sport builds, and how it sharpened over fifty years
A sport selects a body before it selects a person. Stand a Summer Olympic basketball squad next to the gymnasts: the median male basketball player measures 195 cm, the median male gymnast 168 cm. That 27 cm gap separates people who are the best in the world at two games played in the same building.
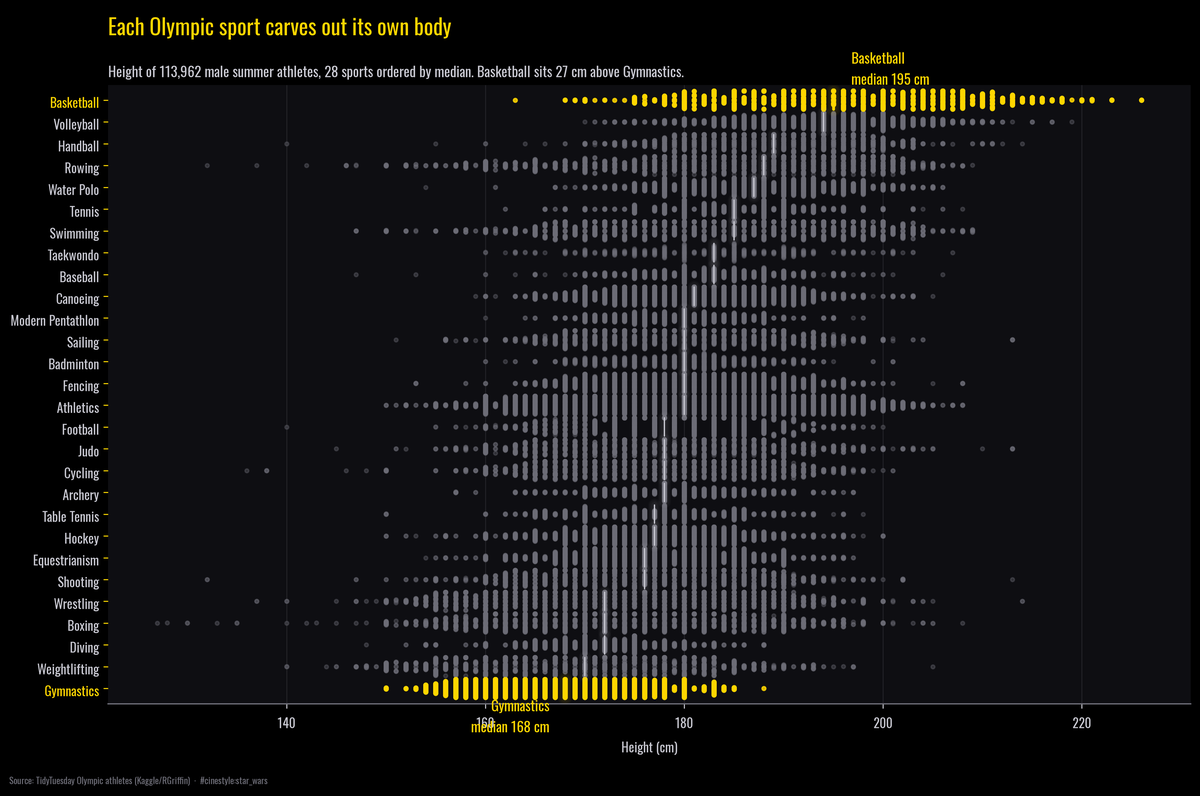
Every dot above is one athlete. The sports stack from short to tall, and the two ends are highlighted. The middle sports overlap, and the two ends barely do.
The data is the TidyTuesday Olympic record: 271,116 athlete-event rows spanning 1896 to 2016, with name, sex, age, height, weight, sport, and medal. It is athlete-level, and it is incomplete in a way I have to address before any number above earns trust.
The measurements that are not there
Height is missing for 22.2% of all rows, weight for 23.2%. That missingness is not random, and pretending it is would poison everything downstream. The early Games barely recorded bodies at all. In 1896, 87.9% of athletes have no height on file. By 1960 that is down to 10.4%, and by 2016 only 1.3% of athletes are unmeasured.
So I drop the rows without both height and weight rather than impute them, which leaves 206,853 complete-body rows, 76.3% of the data. For the cross-sport comparison I narrow further to male summer athletes, because mixing sexes would smear every distribution and the men have far more rows to lean on. The file has one row per athlete per event, so a gymnast who enters several apparatus events would count several times. I keep one row per athlete per Games, which turns 113,962 male summer event rows into 85,896 athlete appearances. I keep only the 28 summer sports with at least 300 measured male athletes, so no ranking rests on a handful of people. None of this recovers the missing early bodies, but it keeps them from biasing the comparison.
The picture above is built only on athletes the Games actually weighed and measured.
A ladder from gymnast to center
Order those 28 sports by median male height and you get a clean ladder, not a cluster.
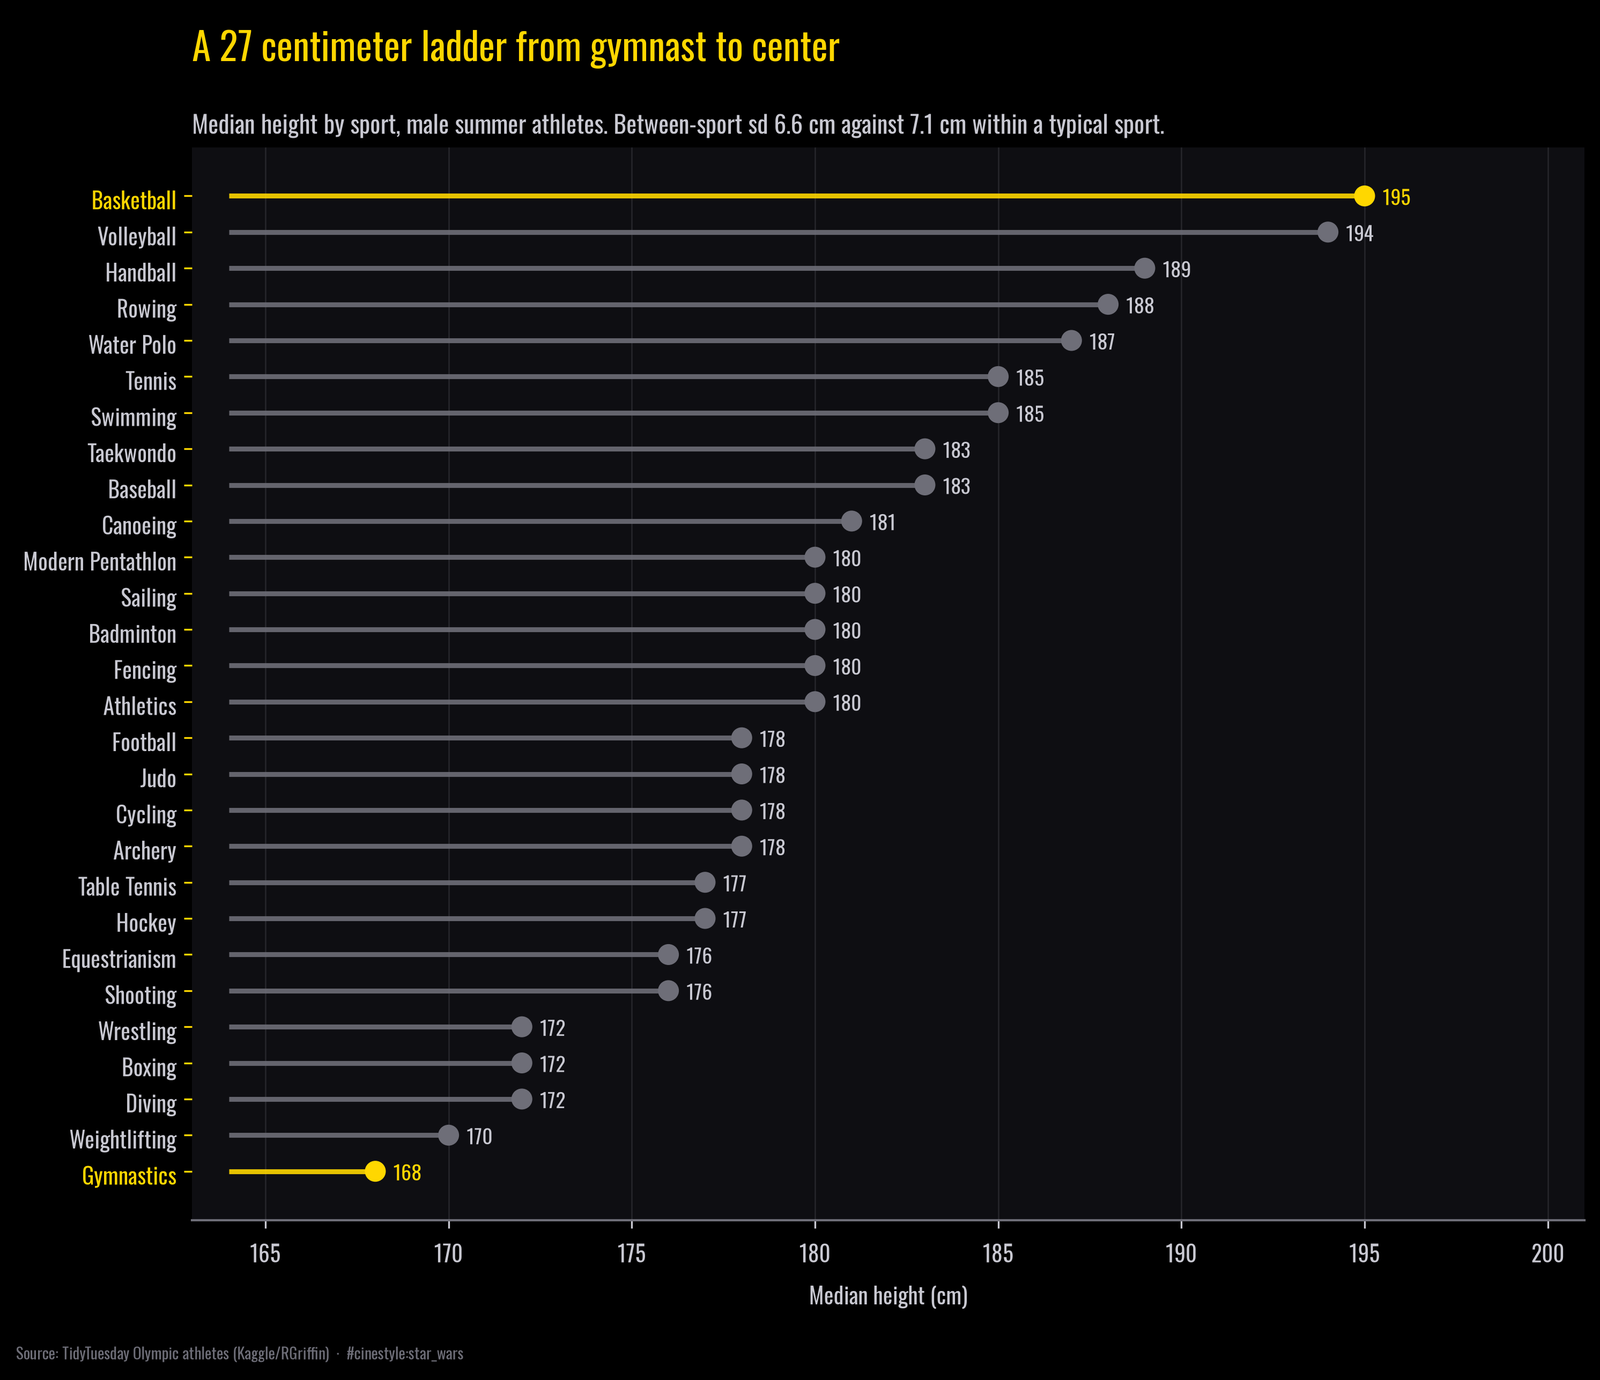
Gymnastics anchors the bottom at 168 cm. Weightlifting, diving, boxing, and wrestling sit just above, all compact sports where a long lever is a liability. The top is the reach economy: basketball at 195 cm, volleyball at 194, handball at 189, rowing at 188. The gap from floor to ceiling is 27 cm.
The spread between sports is real but it is not larger than the spread inside a sport. The standard deviation of the sport medians is 6.7 cm. The typical within-sport standard deviation is 7.1 cm, and across all these men together it is 9.9 cm. In plain terms, sport medians sit closer together than the athletes inside any one sport, so neighboring rungs overlap heavily. Sport narrows the range of bodies without fixing one. The ladder is real, and every rung still overlaps the one above it.
Height is one axis. Density is another.
Height alone misses half of what a sport asks for. A rower and a weightlifter are built for opposite jobs, and height does not separate them, mass does. Plotting median height against median BMI splits the field along a second axis.
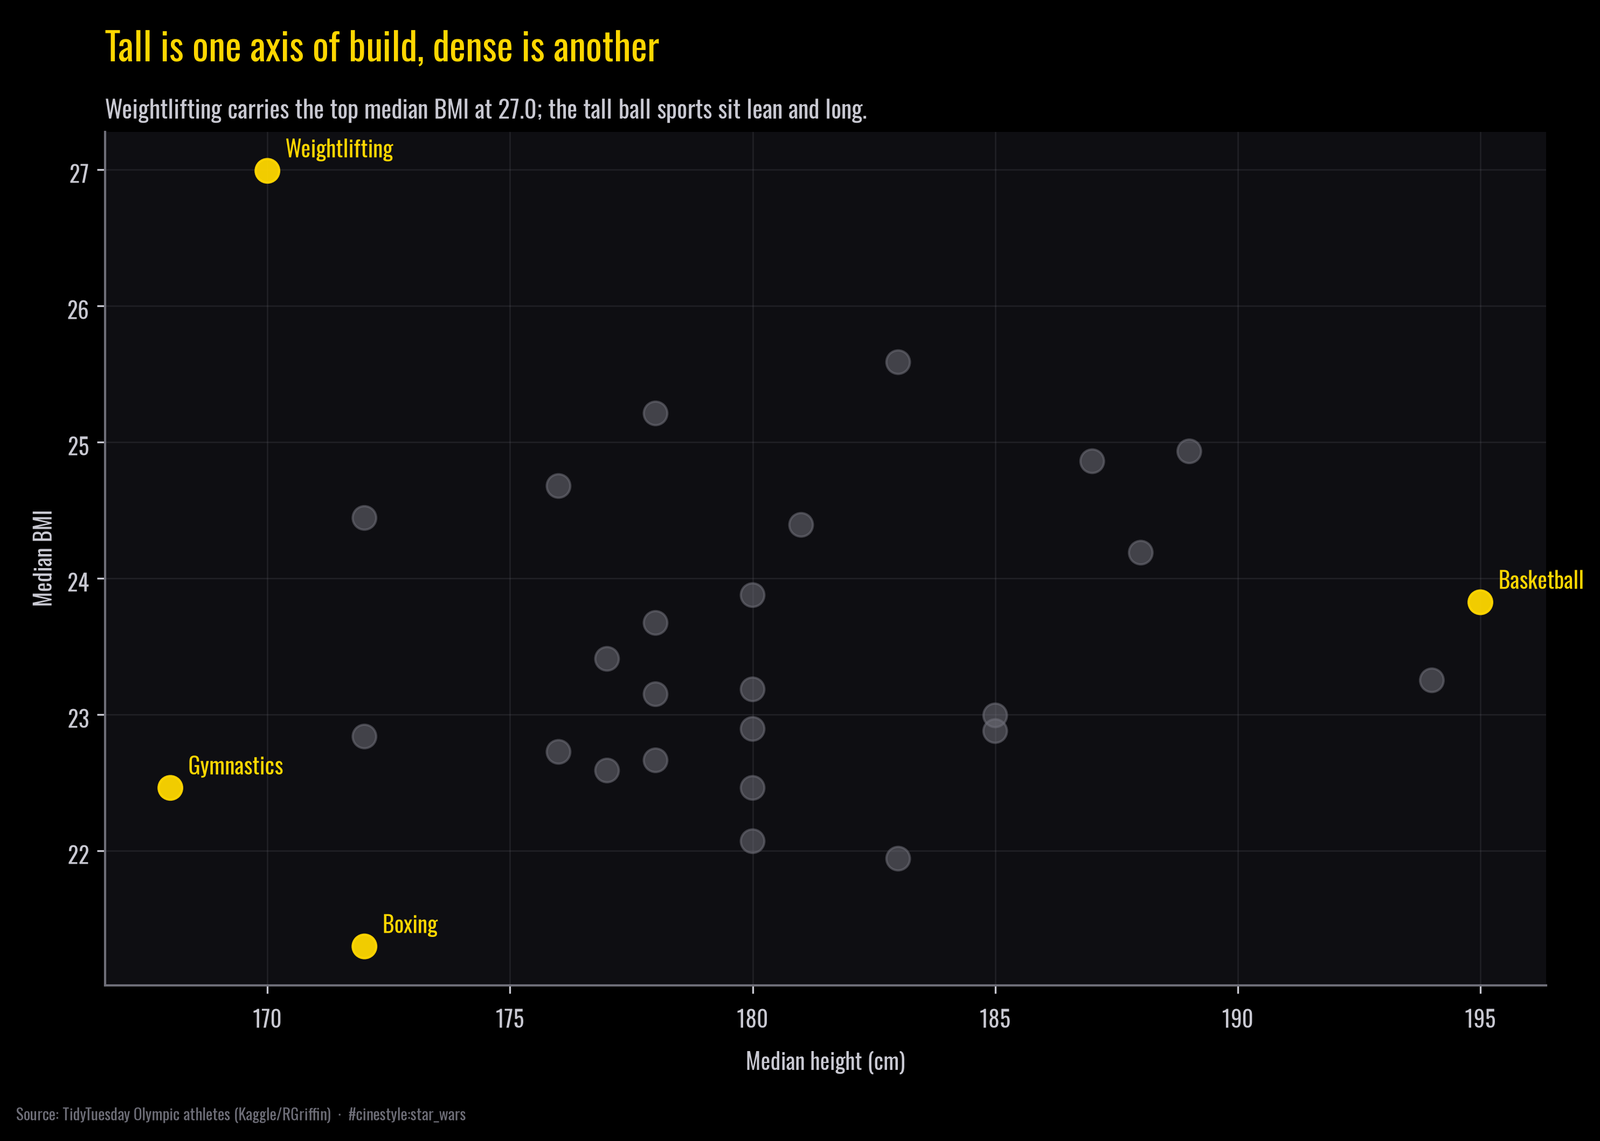
Weightlifting carries the heaviest build by far, a median BMI of 27.0, while standing among the shortest sports at 170 cm. That is the compact-and-dense corner: short levers, maximum mass behind them. The opposite corner is boxing, leanest in the field at a BMI of 21.3, where carrying spare weight only means fighting in a heavier class against bigger people. The tall ball sports land in the middle of the BMI range, long and lean rather than heavy. Height buys reach, and several sports reward mass instead.
The bodies pulled apart over fifty years
The ladder is not a fixed fact of the sports. It got steeper. Track median height by decade from the 1960s, when measurement coverage finally became reliable, through the 2010s, and the sports visibly diverge.
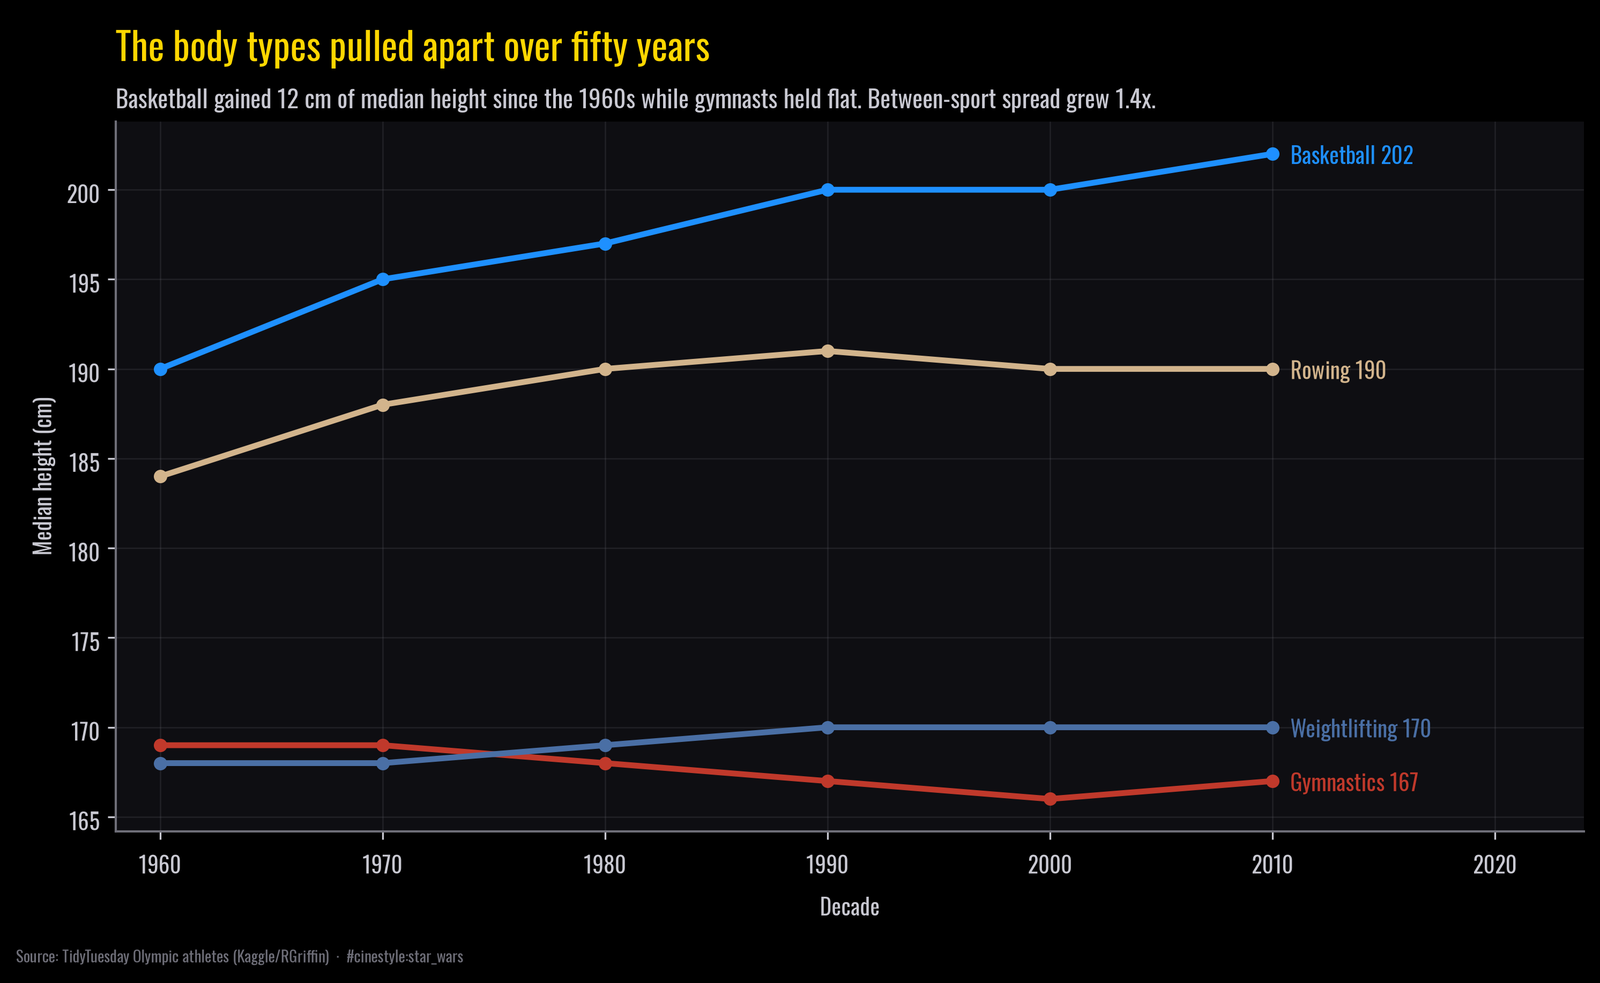
Basketball climbed from a median of 190 cm in the 1960s to 202 cm in the 2010s, a 12 cm gain in half a century. Rowing rose 6 cm over the same window. Gymnastics went the other way, from 169 cm down to 167, holding flat or drifting slightly shorter while the tall sports ran away from it. Weightlifting barely moved, up 2 cm. Most of basketball’s gain came early: 190 to 200 cm by the 1990s, then only 2 cm more by the 2010s.
That divergence shows up in one number. The standard deviation of median height across sports was 5.76 cm in the 1960s, over the 21 sports with at least 30 measured men that decade. By the 2010s it was 7.88 cm across 27 sports, a 1.37x widening. The sports did not just have different body types in 1960. They have been actively sorting harder ever since, each pulling its athletes further toward the build its game rewards.
What the data will and will not tell you
This record stops in 2016 and covers only athletes the Games measured, which before 1960 is a thin and biased slice. The cross-sport numbers are male summer athletes by design, so do not read the 27 cm gap as a claim about women or winter sports. BMI is a crude proxy for build, and it counts muscle the same as fat, which is exactly why weightlifting tops it. Every figure here is a median across thousands of people, not a rule about any one athlete.
What survives all of that is sturdy. The bodies at the Olympics are sorted by sport, the sort runs from 168 to 195 cm, mass adds a second axis the ranking hides, and the sorting has sharpened for fifty years. The athlete does not pick the sport so much as the sport picks the body, and since the 1960s it has gotten pickier.