// article
Unemployment by Industry
Construction hit 27% unemployment. Government never cracked 6.
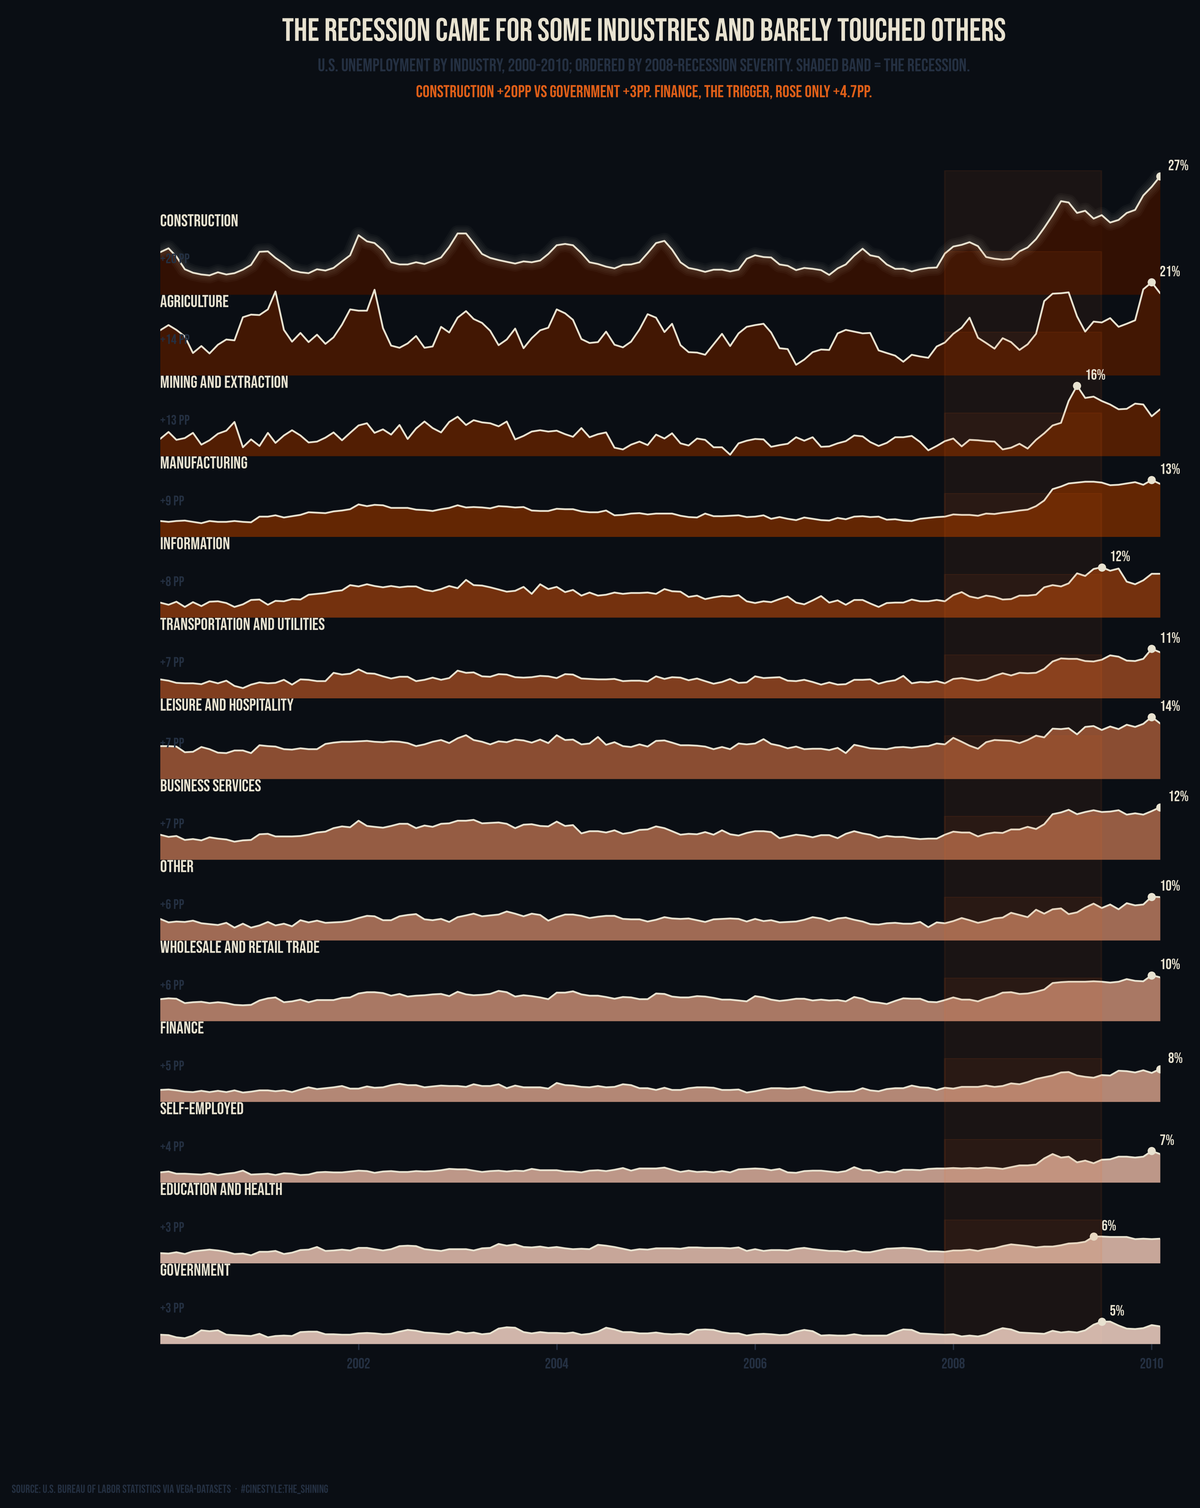
The 2008 recession was one event on the calendar and fourteen different events on the ground. Stack the industries by how hard it hit them and the story falls out as a staircase. Construction sits at the top, its rate exploding by 20 points; government anchors the bottom, lifting less than 3. Finance, the sector that caused the thing, is down near the floor too, up only 4.7. The same recession band runs through every row at the same time. The only thing that changed was whose payroll you were on.
In February 2010, more than one in four construction workers in this BLS series was unemployed. The rate was 27.1%. I recomputed it twice because it looked like a typo. In the calm stretch of 2006 and 2007, construction sat at 7.0%. So the recession did not nudge construction unemployment. It nearly quadrupled it, adding 20.1 percentage points.
Now hold that next to government. Over the same window, government unemployment went from a 2.3% baseline to a peak of 5.1%, an increase of 2.8 points. For government workers the recession was a bad year, not a collapse.
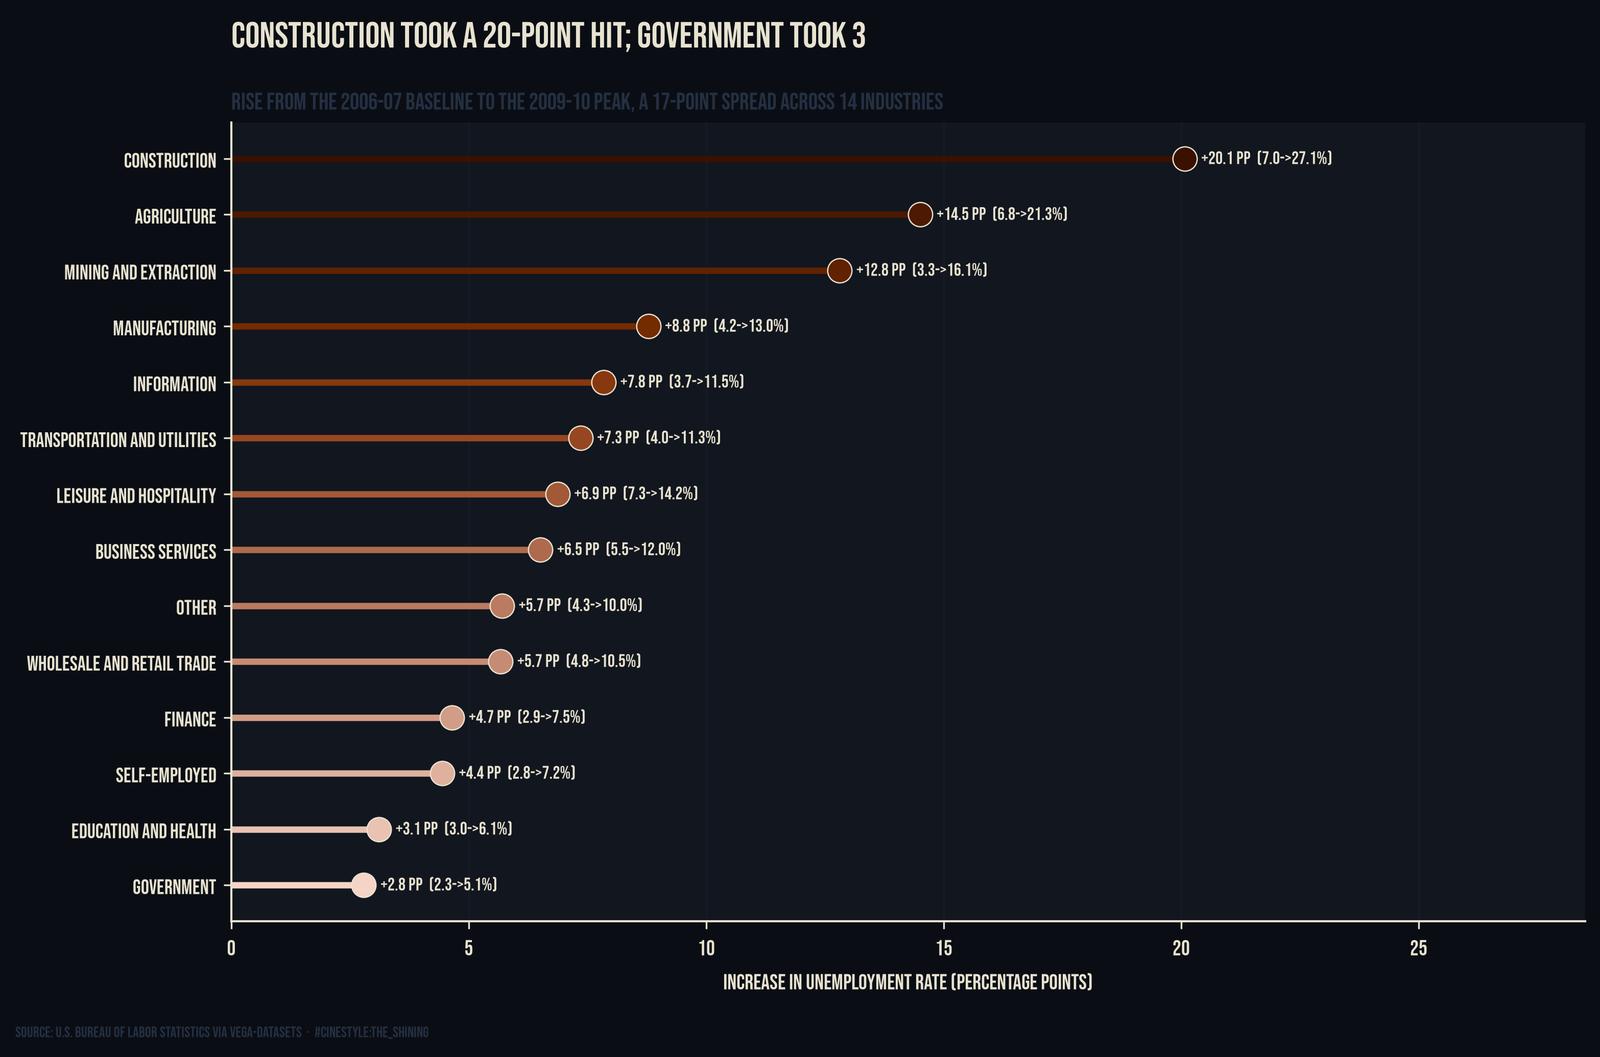
The hardest-hit industry took a 20.1-point hit; the least-hit took 2.8. The spread between them is 17.3 percentage points. “The 2008 recession” is a single phrase covering experiences that have almost nothing in common.
The data
This is monthly unemployment by industry from the U.S. Bureau of Labor Statistics, pulled through the vega-datasets mirror (CATALOG records it as “BLS via vega-datasets”). It covers 14 industry buckets, 122 months each, running January 2000 through February 2010, 1,708 rows total. The rate column is the unemployment rate in percent for each industry-month; count is unemployed persons in thousands. I worked off rate throughout.
My method was deliberately blunt. For each industry I took a pre-recession baseline as the mean rate over 2006 and 2007, then found the single highest monthly rate during 2009 and 2010, and called the difference the hit, in percentage points. No detrending, no seasonal adjustment of my own. These are the BLS industry definitions and the BLS published rates, taken at face value. The crude method has one bias worth knowing about, which I cover in the timing section.
The ranking
Sorted by how many points each industry’s rate climbed from baseline to peak:
| Industry | Baseline | Peak | Increase | Peak month |
|---|---|---|---|---|
| Construction | 7.0% | 27.1% | +20.1 pp | 2010-02 |
| Agriculture | 6.8% | 21.3% | +14.5 pp | 2010-01 |
| Mining and Extraction | 3.3% | 16.1% | +12.8 pp | 2009-04 |
| Manufacturing | 4.2% | 13.0% | +8.8 pp | 2010-01 |
| Information | 3.7% | 11.5% | +7.8 pp | 2009-07 |
| Transportation and Utilities | 4.0% | 11.3% | +7.4 pp | 2010-01 |
| Leisure and hospitality | 7.3% | 14.2% | +6.9 pp | 2010-01 |
| Business services | 5.5% | 12.0% | +6.5 pp | 2010-02 |
| Other | 4.3% | 10.0% | +5.7 pp | 2010-01 |
| Wholesale and Retail Trade | 4.8% | 10.5% | +5.7 pp | 2010-01 |
| Finance | 2.9% | 7.5% | +4.7 pp | 2010-02 |
| Self-employed | 2.8% | 7.2% | +4.4 pp | 2010-01 |
| Education and Health | 3.0% | 6.1% | +3.1 pp | 2009-06 |
| Government | 2.3% | 5.1% | +2.8 pp | 2009-07 |
The shape of this list matches the headlines of the time. The goods-producing and physical sectors got wrecked; the institutional ones held. Construction and agriculture top it. At the bottom sit education-and-health and government, the two sectors that run on tax dollars and tuition rather than discretionary demand. They felt a downturn, not a crisis.
One entry surprised me. Finance climbed only 4.7 points, from 2.9% to 7.5%. This was the financial crisis, and the sector at the center of it landed fourth from the bottom of my ranking. The damage in finance was concentrated in a handful of firms and in asset prices, not in the broad unemployment rate for everyone classified under “Finance.” The people swinging hammers paid more of the labor-market bill than the people who packaged the mortgages.
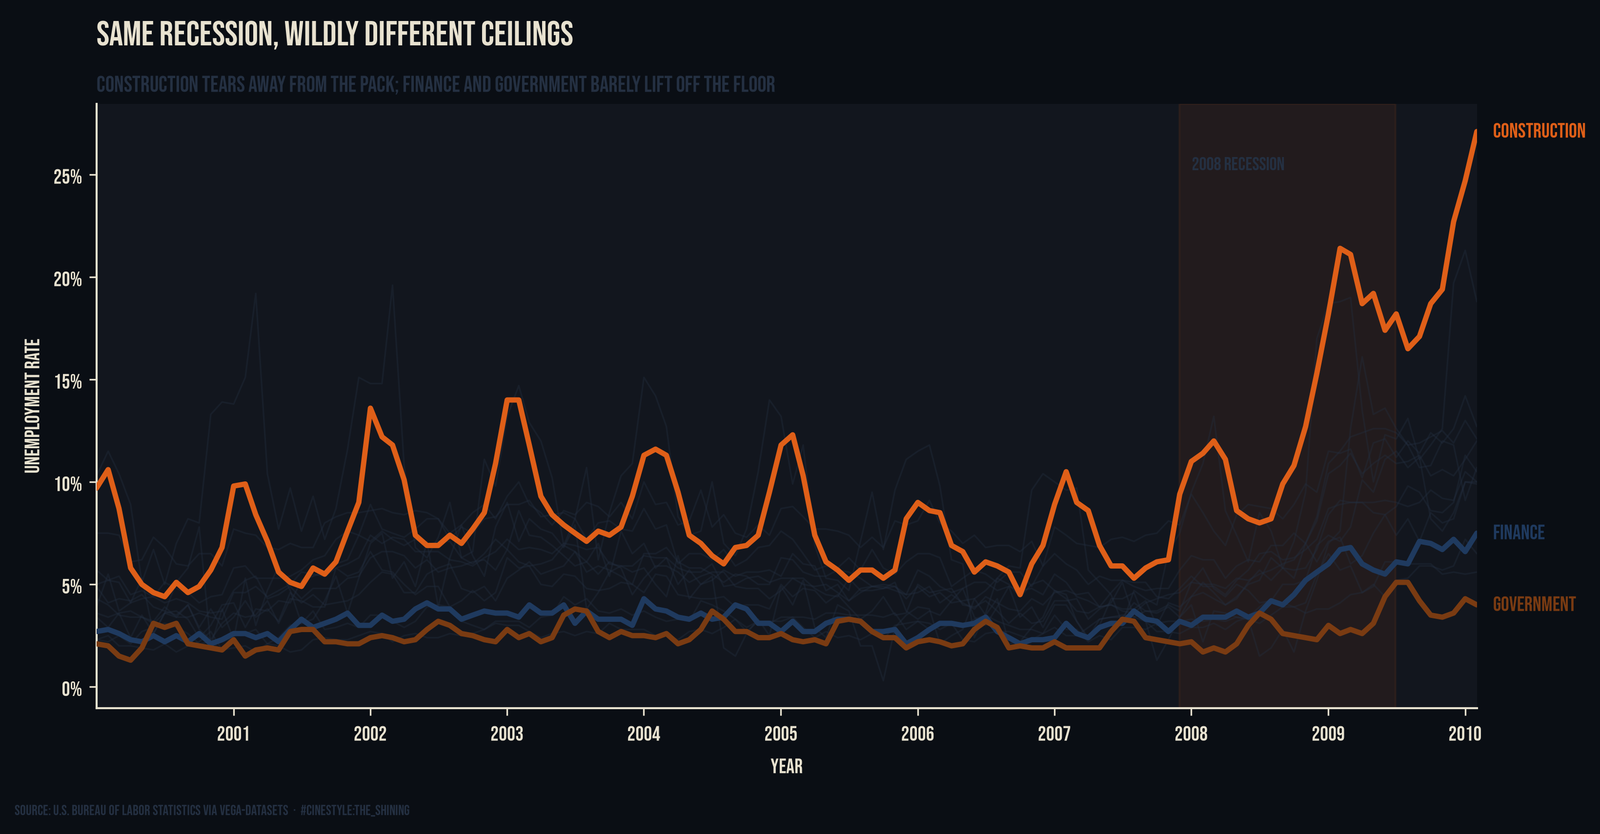
Picture the lines as a rope. Through the 2006 to 2007 baseline they sit twisted together, from a 2.3% government rate to a 7.3% leisure-and-hospitality rate. Late 2007 hits and the rope frays: every strand pulls apart at once. Construction tears away from everything else and just keeps climbing. Government and education-and-health barely lift off the floor. The grey lines are the ten industries I did not label, and even as a faded cloud you can see them spreading. The fanning-out is the recession.
Timing and the recovery problem
The peaks did not all land at once, but most clustered late. The median peak month across the 14 industries is January 2010, near the very end of the data. A few sectors topped out earlier. Mining peaked in April 2009 and recovered meaningfully; government and education-and-health peaked mid-2009. The big physical sectors were still climbing or only just cresting when the series runs out.
The timing also exposes the bias in my method. Ten of the 14 peaks land in January or February 2010, the dead of winter, and these rates are not seasonally adjusted. My baseline is a two-year average, while my peak is the single worst month, so industries with a winter slump get a head start. Construction (peak February 2010) and agriculture (peak January 2010) are the most exposed. The ranking is also a ranking of points, not multiples. Mining went from 3.3% to 16.1%, nearly five times its baseline, a bigger multiple than construction’s move from 7.0% to 27.1%.
That is the honest caveat, and it is a large one. This data ends in February 2010. For several industries, including construction, the highest rate I found is the last month available. Construction’s peak of 27.1% is simply where the line was when the data stopped. It had not turned the corner. Any recovery I measure here is partial and unreliable.
With that warning attached, the early movers did claw back. Mining gave up 5.4 of its 12.8 run-up points by series end, about 42% recovered. Government recovered roughly 39% of its smaller climb. Leisure and hospitality got back 22%, information 19%, and agriculture 17%, about what education and health managed (16%). Manufacturing recovered 10%. Construction, business services, and finance recovered nothing, because their peak month is the last month of data. We are watching the fire, not the rebuild.
What I would take from this
The national unemployment rate is a blunt instrument. The BLS headline rate rose to around 10% nationally in this era, and that number is true and useless at the same time, because nobody experiences the average. A construction worker lived through a 27% rate. A government employee lived through 5%. Same recession, same calendar, a 17-point difference in how hard the floor came up to meet them.
If you ever build a model on a single aggregate labor number, this is the argument for disaggregating first. The variance across industries dwarfs the headline. The sectors that held up were the boring, demand-insensitive ones. When the discretionary spending stopped, the people who built and dug and made things were the first to find out.