// article
Old Faithful's Two Modes
Old Faithful is two geysers wearing a trench coat
Two cluster centers fall out of the data at (2.04 min eruption, 54.5 min wait) and (4.29 min, 80.0 min). Old Faithful does not erupt for one typical duration plus noise. It does one of two things: a short pop followed by a short wait, or a long blast followed by a long wait. The middle is nearly empty.
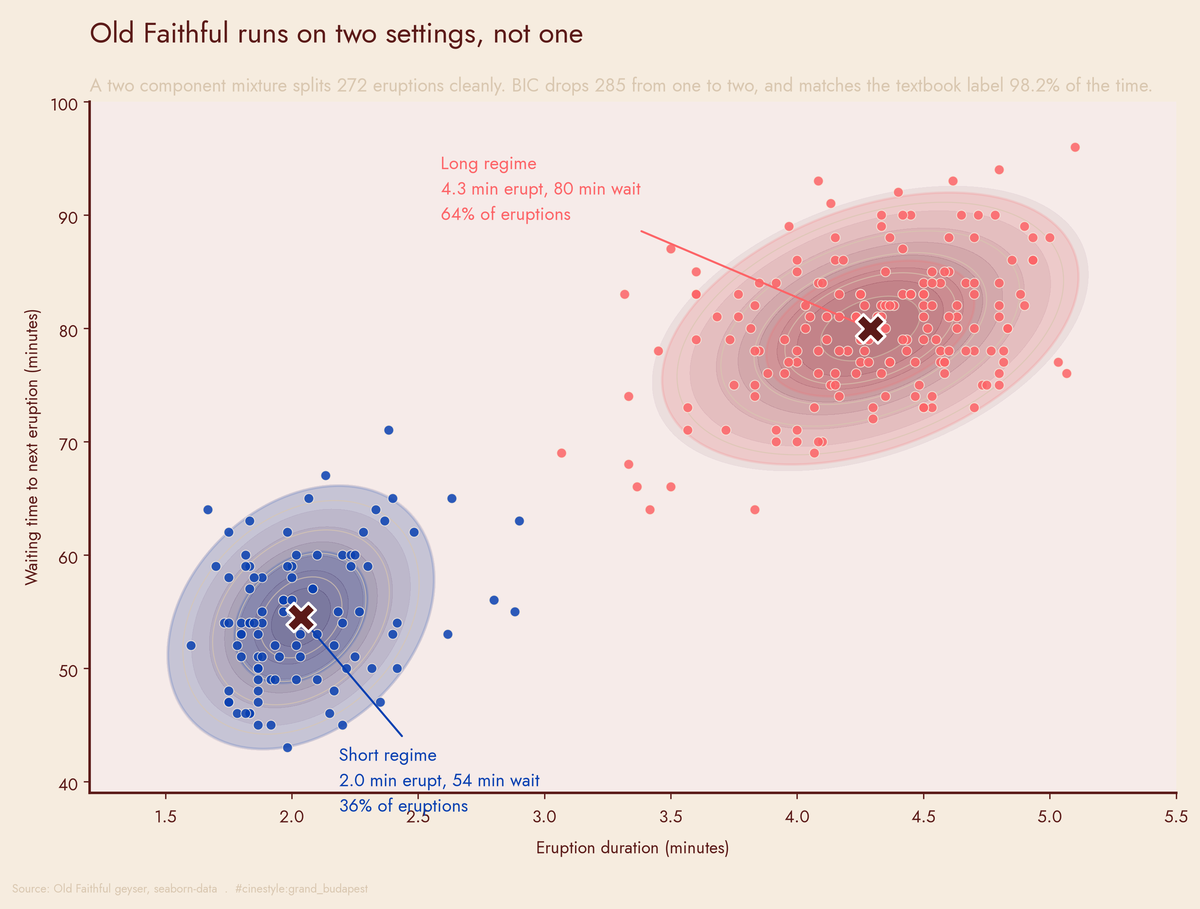
I expected noise around a single mean and found a histogram with a hole in it. The picture above carries the argument: fit two Gaussians to the raw duration and waiting pairs, and the geyser sorts itself into two clouds with daylight between them.
The data
load("geyser") from seaborn-data: 272 eruptions of Old Faithful, three columns. duration is how long the eruption lasted in minutes, waiting is the gap to the next one, and kind is a pre-baked short or long label that came with the set. Small, clean, and old enough to be in every intro stats textbook. I will get to why that is both the point and the catch.
First thing I always do with a single variable is plot its distribution and look for one peak. Here I got two. The duration density has modes at 1.99 and 4.37 minutes with a clear trough between them at 3.00 minutes. Waiting does the same thing: peaks near 53.8 and 79.9 minutes, dip at 65.5. Both columns are bimodal on their own, before I have clustered anything.
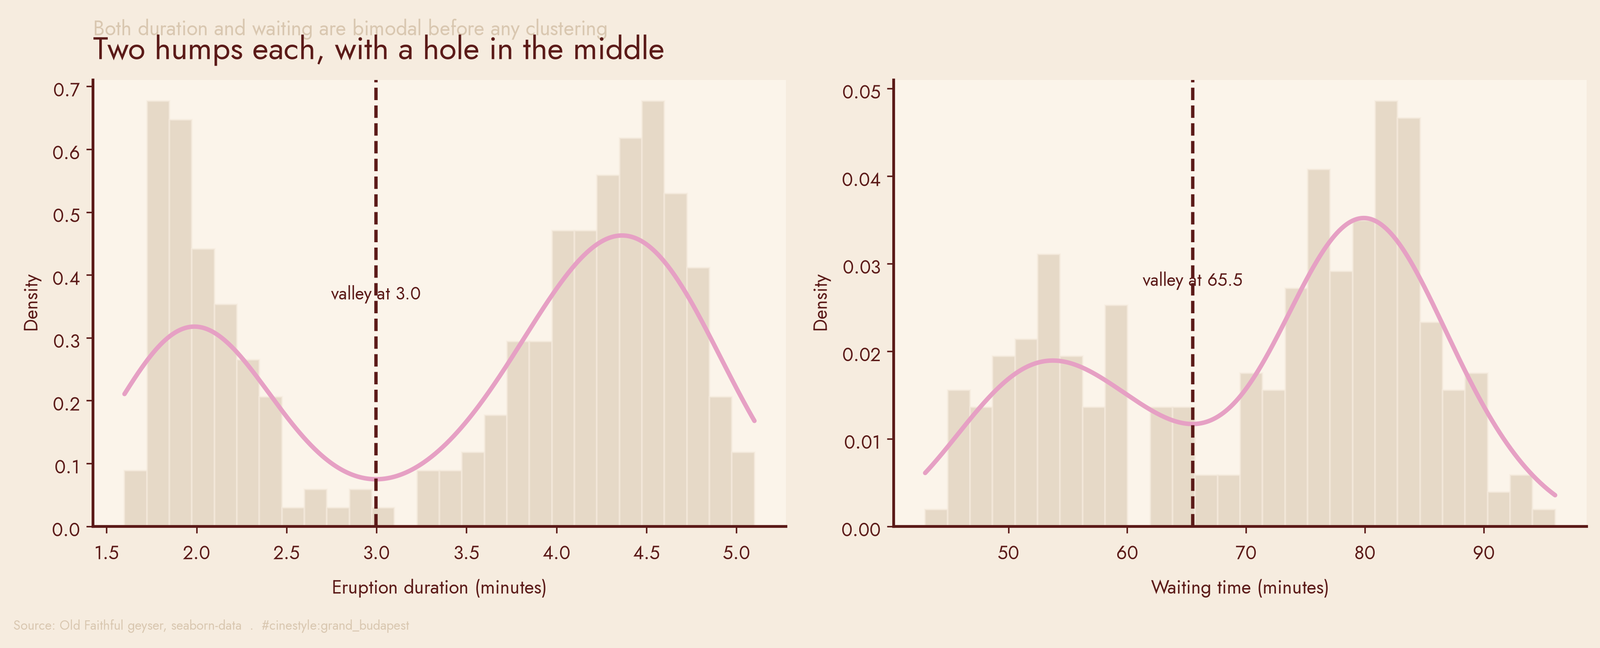
Look at the dip in the left panel. If duration were one process with spread, you would see a single hump, maybe skewed. Instead there is a valley right where the average would be. Only about a third of eruptions, 36%, land below the duration dip. The short regime is the minority, and the data already knows which eruptions belong to it before any model touches it.
The model that did not need to be deep
A neural net would be overkill here; a two-component Gaussian mixture on the raw (duration, waiting) pairs fits.
I fit GaussianMixture(n_components=2) from scikit-learn, full covariance, ten restarts, and it converged. The two components:
- Short regime: center at 2.04 min, 54.5 min wait, mixing weight 0.356.
- Long regime: center at 4.29 min, 80.0 min wait, mixing weight 0.644.
So roughly 36% of eruptions are short-short and 64% are long-long. Those weights match the histogram dip almost exactly. The kernel density estimate and the mixture model found the same split without sharing any code.
The usual explanation is physical, not statistical: a short eruption leaves the chamber partly full, so it refills faster and you wait less, while a long eruption empties it and the next one takes longer to build. I did not test that mechanism; the data only shows the two regimes it predicts. The mean wait in the short cluster is 54.5 minutes; in the long cluster it is 80.0. The duration centers, 2.04 against 4.29, are more than two minutes apart, about double. Two Gaussians fit this data because it has two regimes, not because the model is flexible.
Does the model agree with the label that came in the box?
The dataset ships a kind column. I never showed it to the mixture model. So how often does my unsupervised cluster assignment match the human label?
The cluster assignment matches the label on 267 of 272 eruptions, 98.2% agreement.
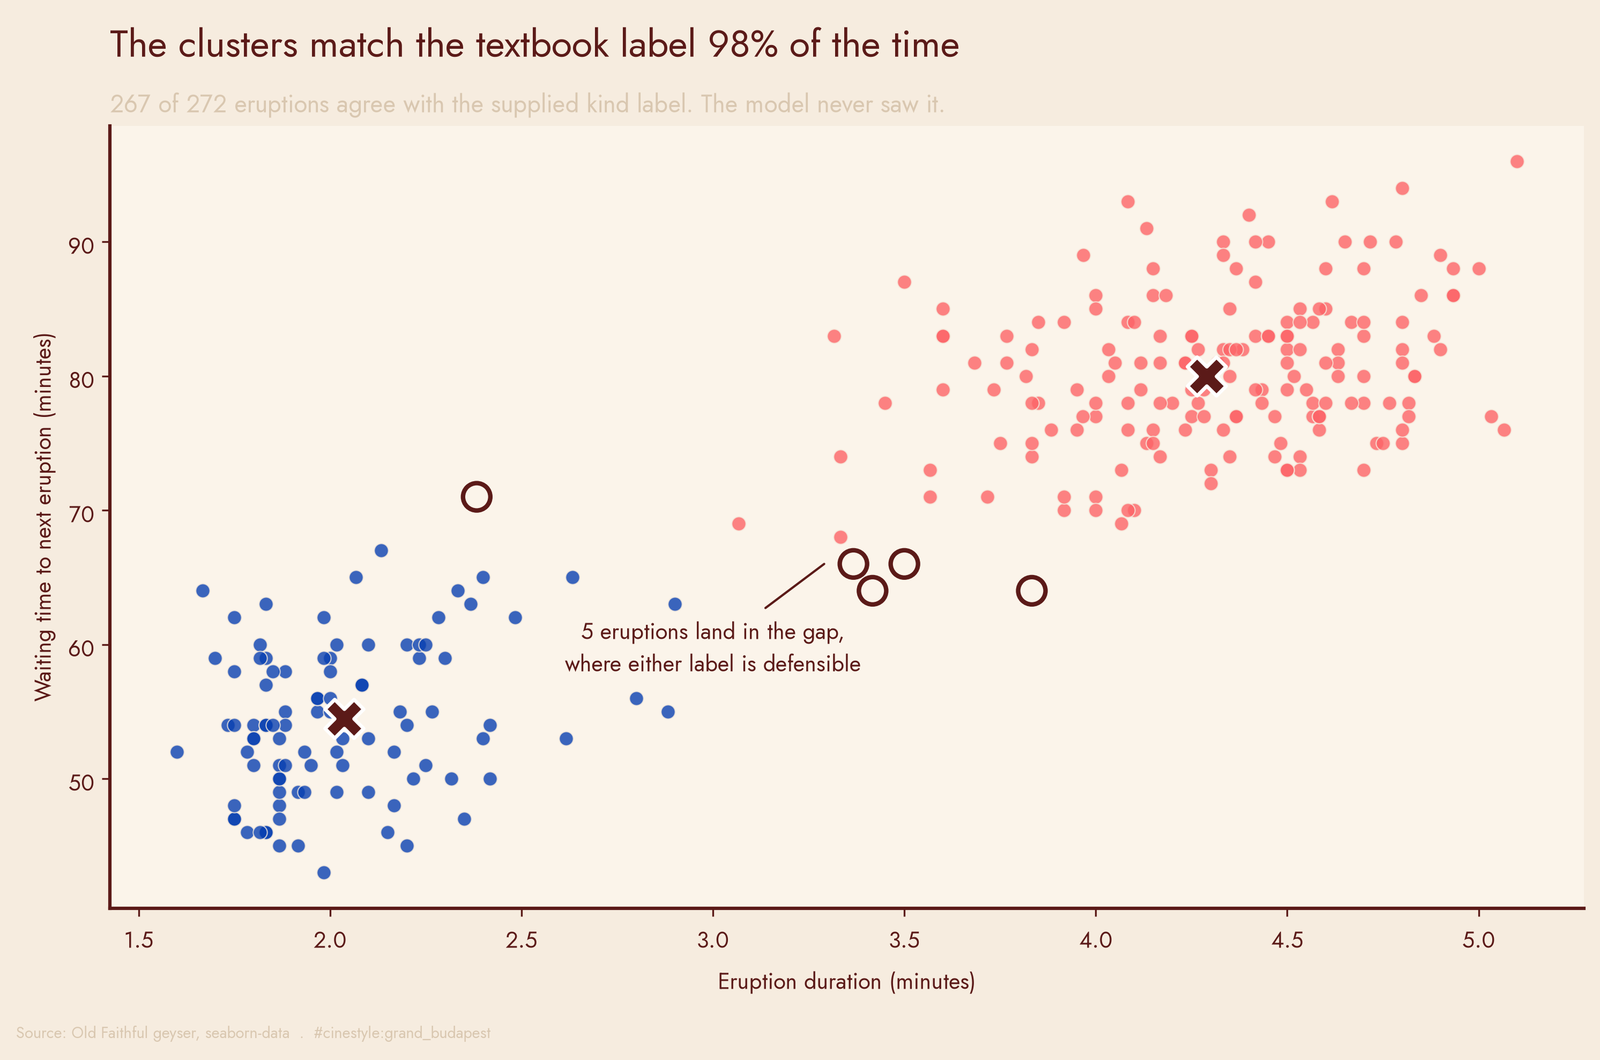
The five disagreements split four and one: four eruptions the model calls long carry a short label, and one it calls short carries a long label. They are the circled points in the scatter, and in the figure they sit near the gap between the clouds. I did not save their durations, so read that placement off the chart, not off a number. Away from the gap, the model and the label agree.
That is the part I re-ran twice. An unsupervised method recovering a supervised label at 98% is the sort of result that usually means I leaked the label somewhere. I had not leaked it: the mixture saw only the two numeric columns, so the agreement reflects how cleanly the clusters separate.
What about a plain line?
Before the clustering, the obvious move is to regress waiting on duration. And it works fine: slope 10.73, meaning each extra minute of eruption buys you about 10.7 more minutes before the next one. R-squared is 0.811; Pearson r is 0.901. By normal standards that is a strong fit and you would ship it.
But a line is the wrong mental model here, even at R-squared 0.81. The relationship is not a smooth ramp where 3-minute eruptions sit halfway up. It is two clouds that happen to lie along a diagonal. The line is fitting the gap between the clusters as if it were signal. Almost no eruptions actually live near the regression line’s middle, because almost no eruptions are 3 minutes long. The high R-squared is real but it is flattering. It measures the separation between two groups and calls it a trend.
Why two and not three
To make sure I was not just seeing what I wanted, I let BIC pick the number of components. Lower is better, and it bottomed out hard at two.
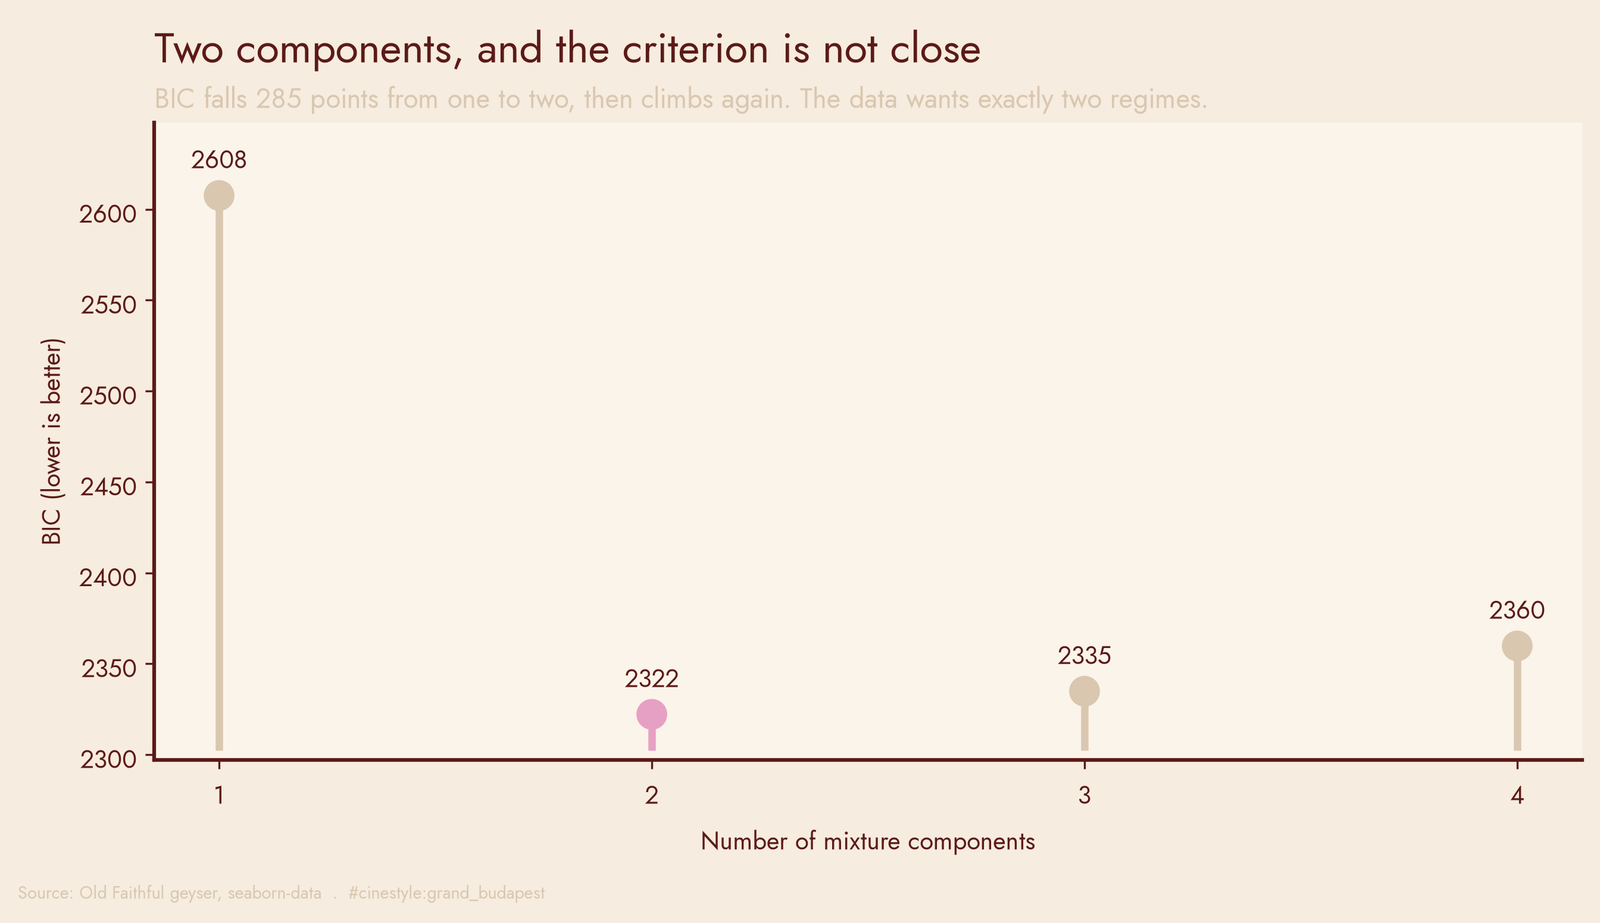
One component scores 2607.6. Two drops to 2322.2, a fall of 285 points, which in BIC terms is not close. Three components creeps back up to 2334.9, four to 2359.8. The data wants exactly two regimes and penalizes you for inventing a third. BIC picks two without any tuning or elbow judgment.
Where this stops working
This is one geyser, 272 eruptions, and a dataset that has shipped with R as faithful for decades, taught precisely because it splits this cleanly. Real-world bimodality rarely arrives this gift-wrapped. Old Faithful’s two regimes come from chamber physics that genuinely toggles; most “two clusters” you will meet in production are messier, with overlapping tails and no tidy kind column to check yourself against. So take the 98.2% as a demonstration that the method works when the structure is there, not a promise that it will be there.
But when the structure is real, you do not need much. Two Gaussians and a BIC check told me everything the geyser had to say, and the most expensive thing I ran was a histogram.